
Figure 1:
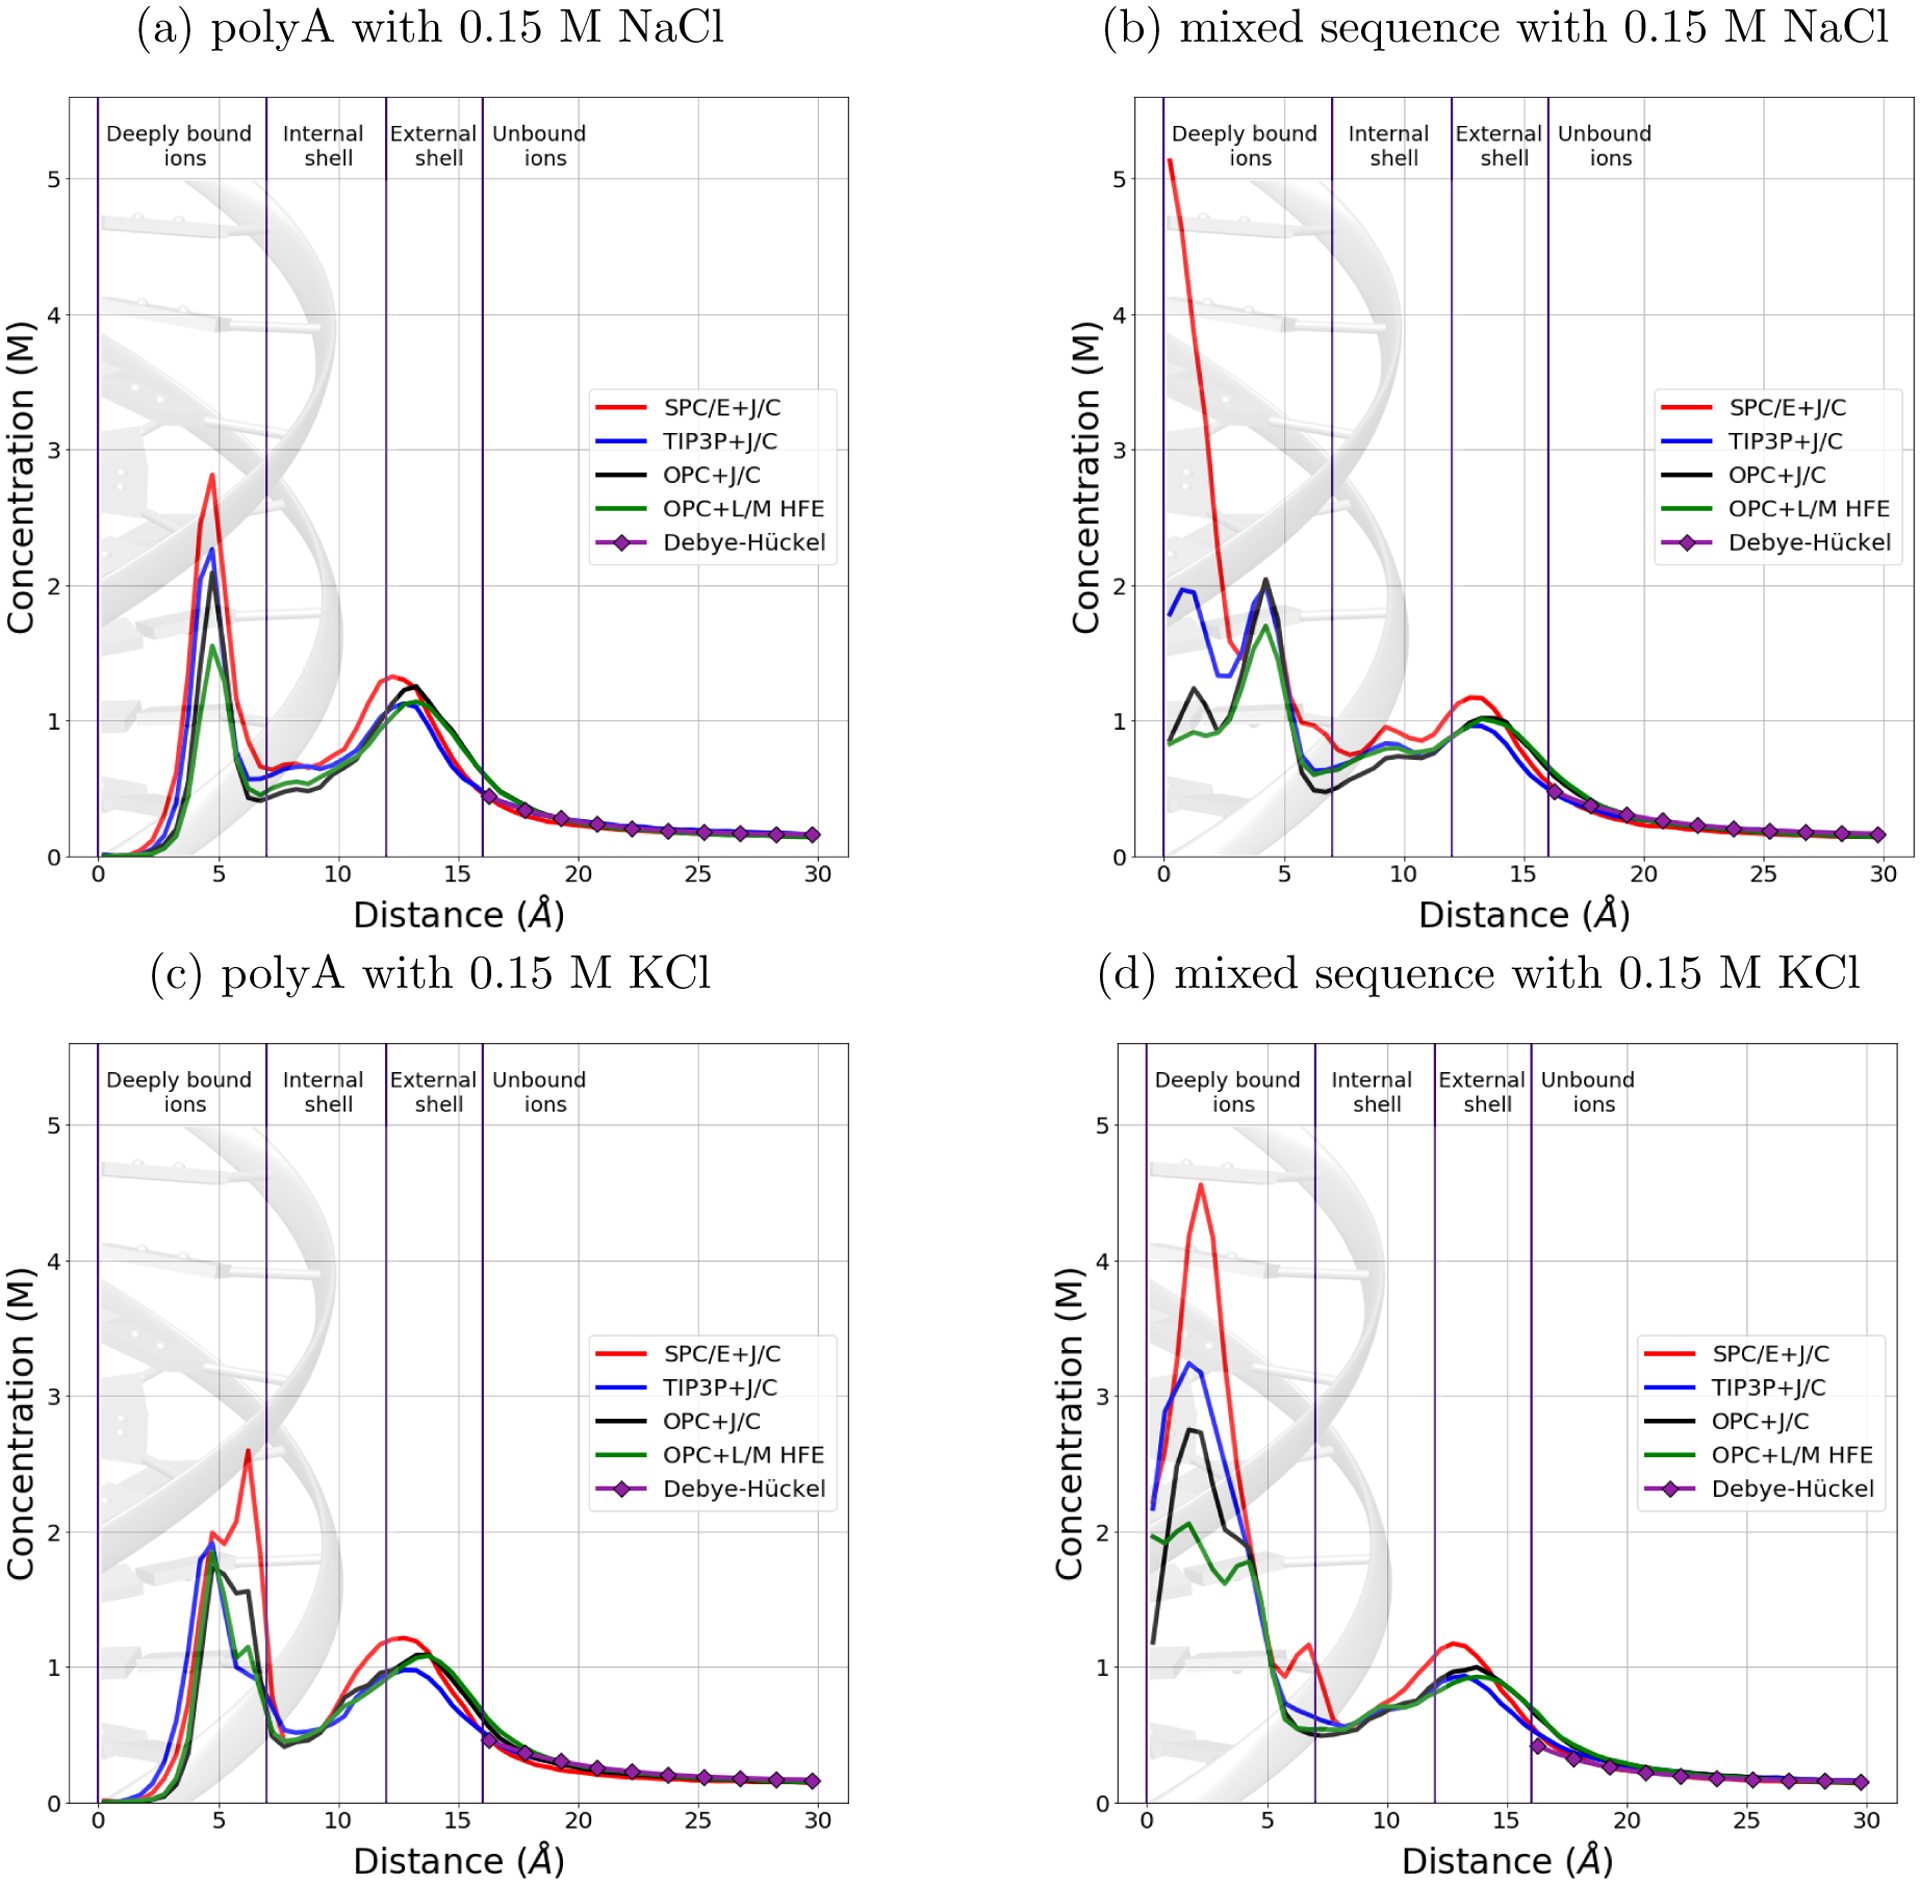
Dependence of sodium and potassium concentration on the distance from the DNA helical axis, from simulations in four different explicit solvent models – combinations of water models and sets of ion parameters. The bulk salt concentration is 0.15 M. All the distributions have almost the same shape beyond 7 Å from the DNA axis. In the order of solvent models SPC/E+J/C, TIP3P+J/C, OPC+J/C and OPC+L/M HFE, the concentration near the helical axis of the DNA drops down significantly regardless of the ion type and DNA sequence. The distribution corresponding to the Debye–Hückel theory is also shown for comparison. The names of the cylindrical shells around the DNA helical axis from Ref.27 are used here for notation convenience.