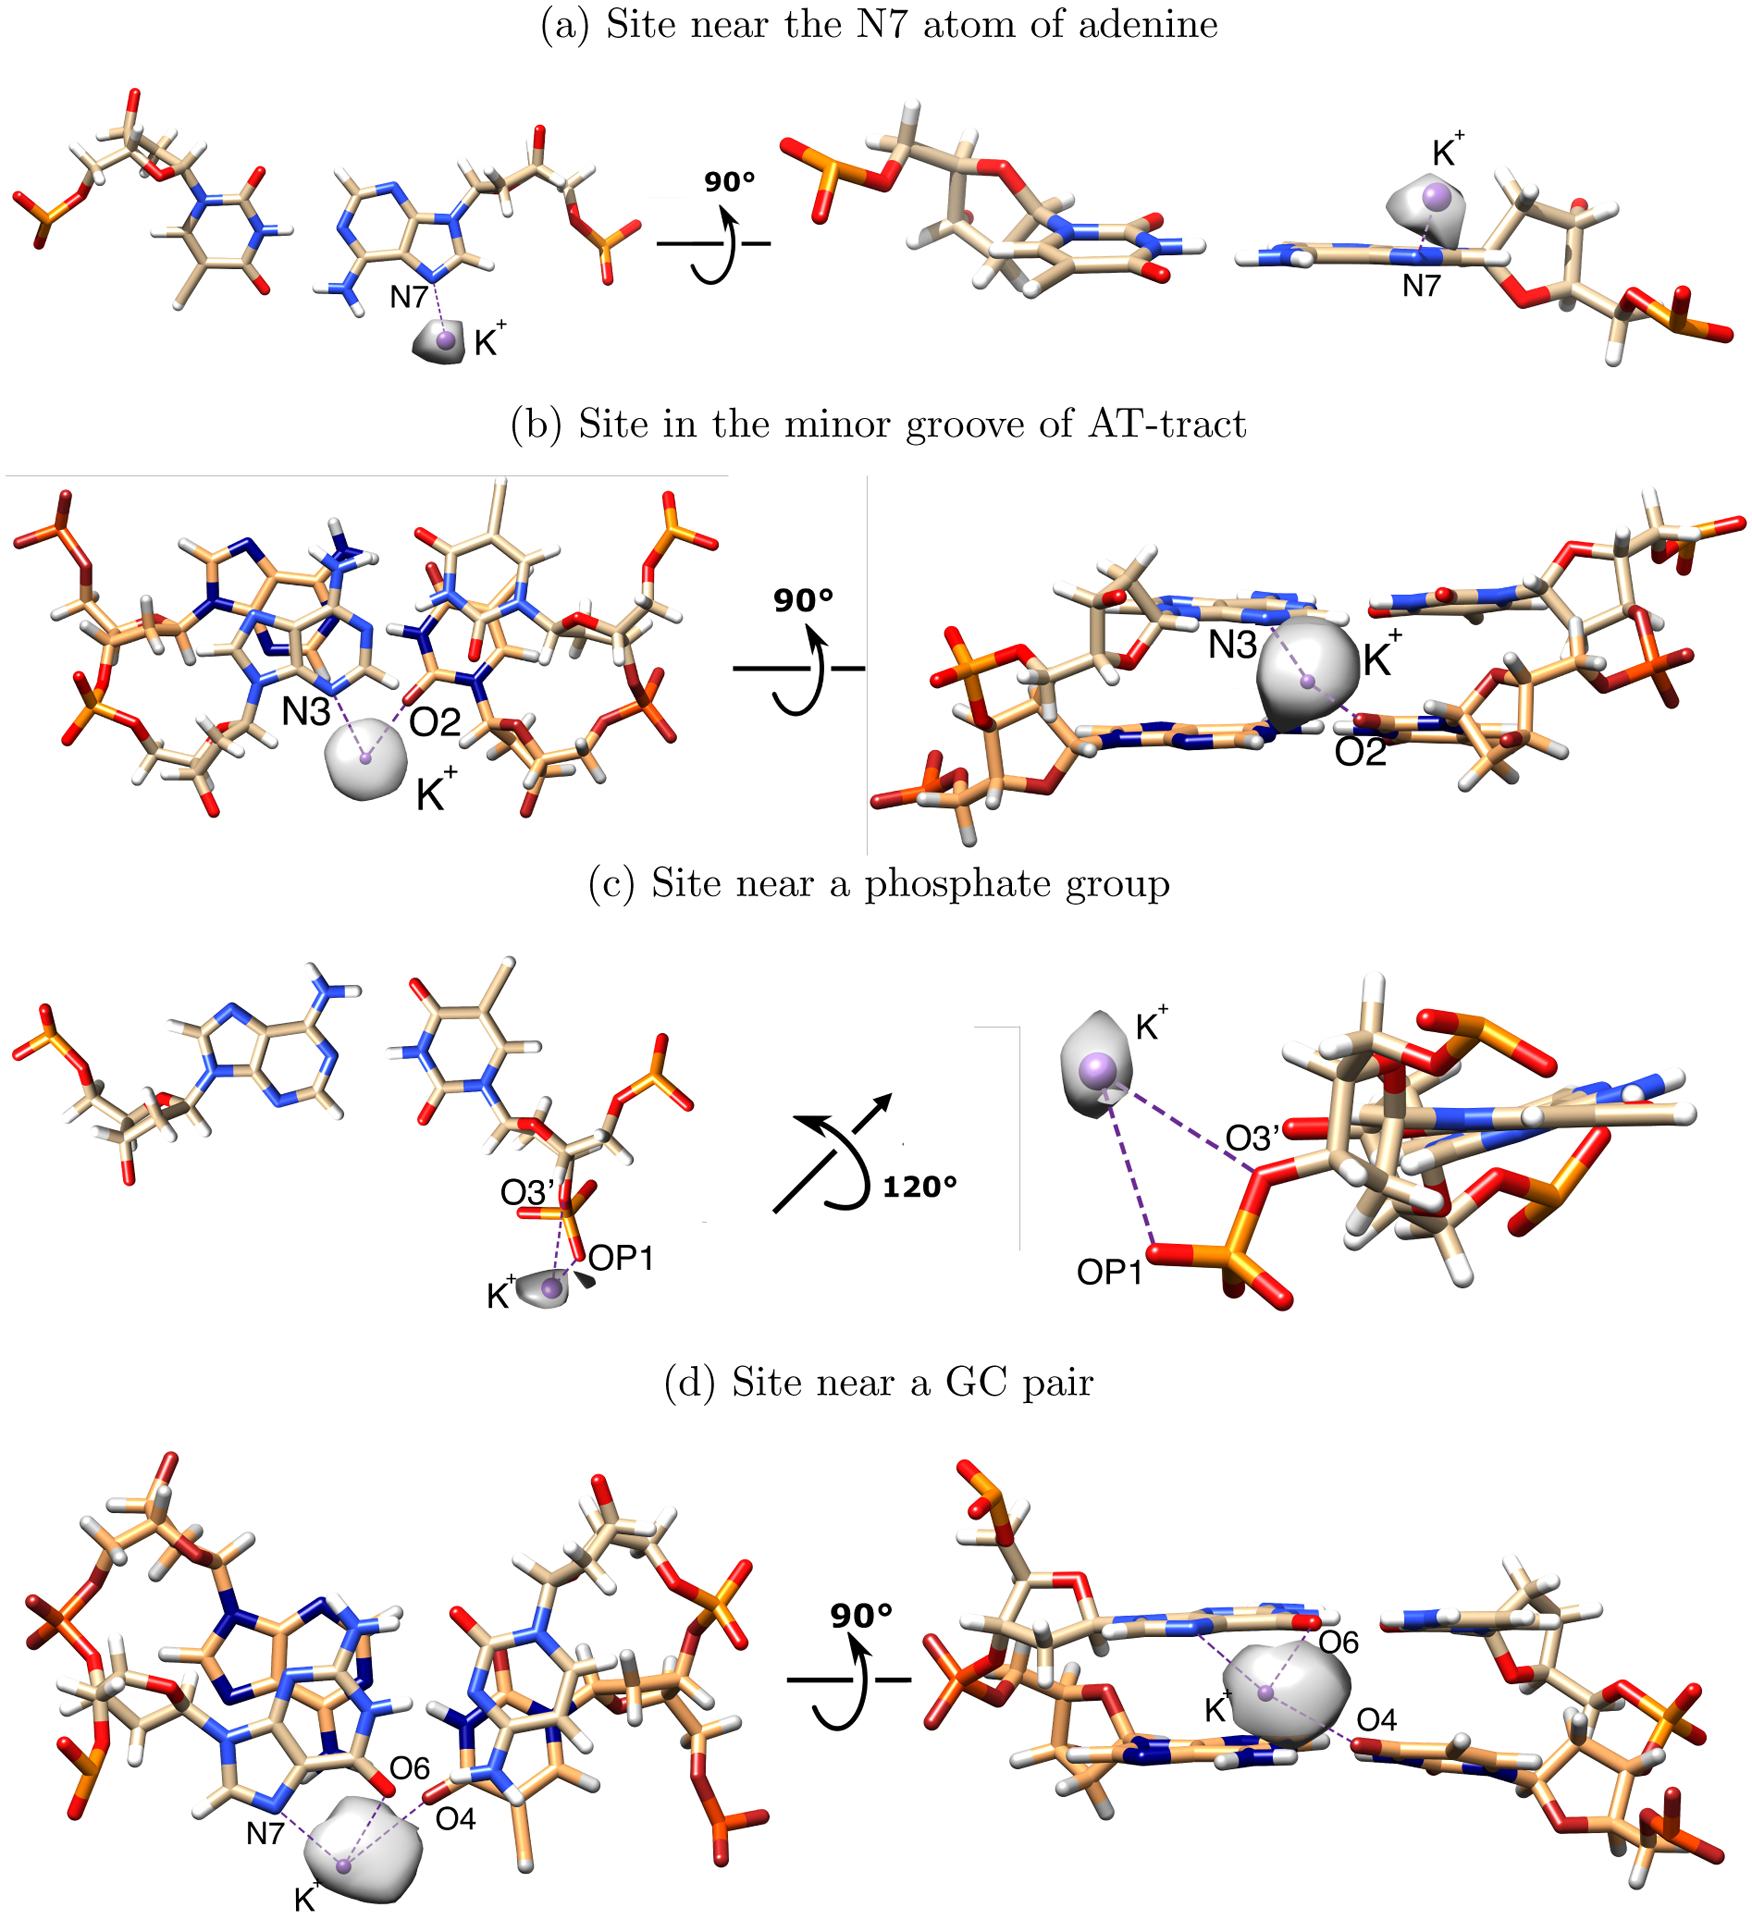
Figure 2:

Typical K+ and Na+ binding sites in the dsDNA structure. Shown are the sites, for which the computed ion density is more than 5 electron charges per Å3. Sodium (not shown) is coordinated by the same sets of atoms, but the occupancy may differ significantly (generally lower). For visual clarity, the density maps of potassium near the binding sites are drawn at the different levels (a: 9 electron charges per Å3; b: 5 electron charges per Å3; c: 7.5 electron charges per Å3; d: 7 electron charges per Å3). Potassium location was fitted to the density map for the panel c; others were taken from the representative snapshots. The binding site near the GC-pair (d) corresponds to sites 1–3 and 10–12 in Figure 3. The binding site in the minor groove of the AT-tract (b) corresponds to site 7 in Figure 3
