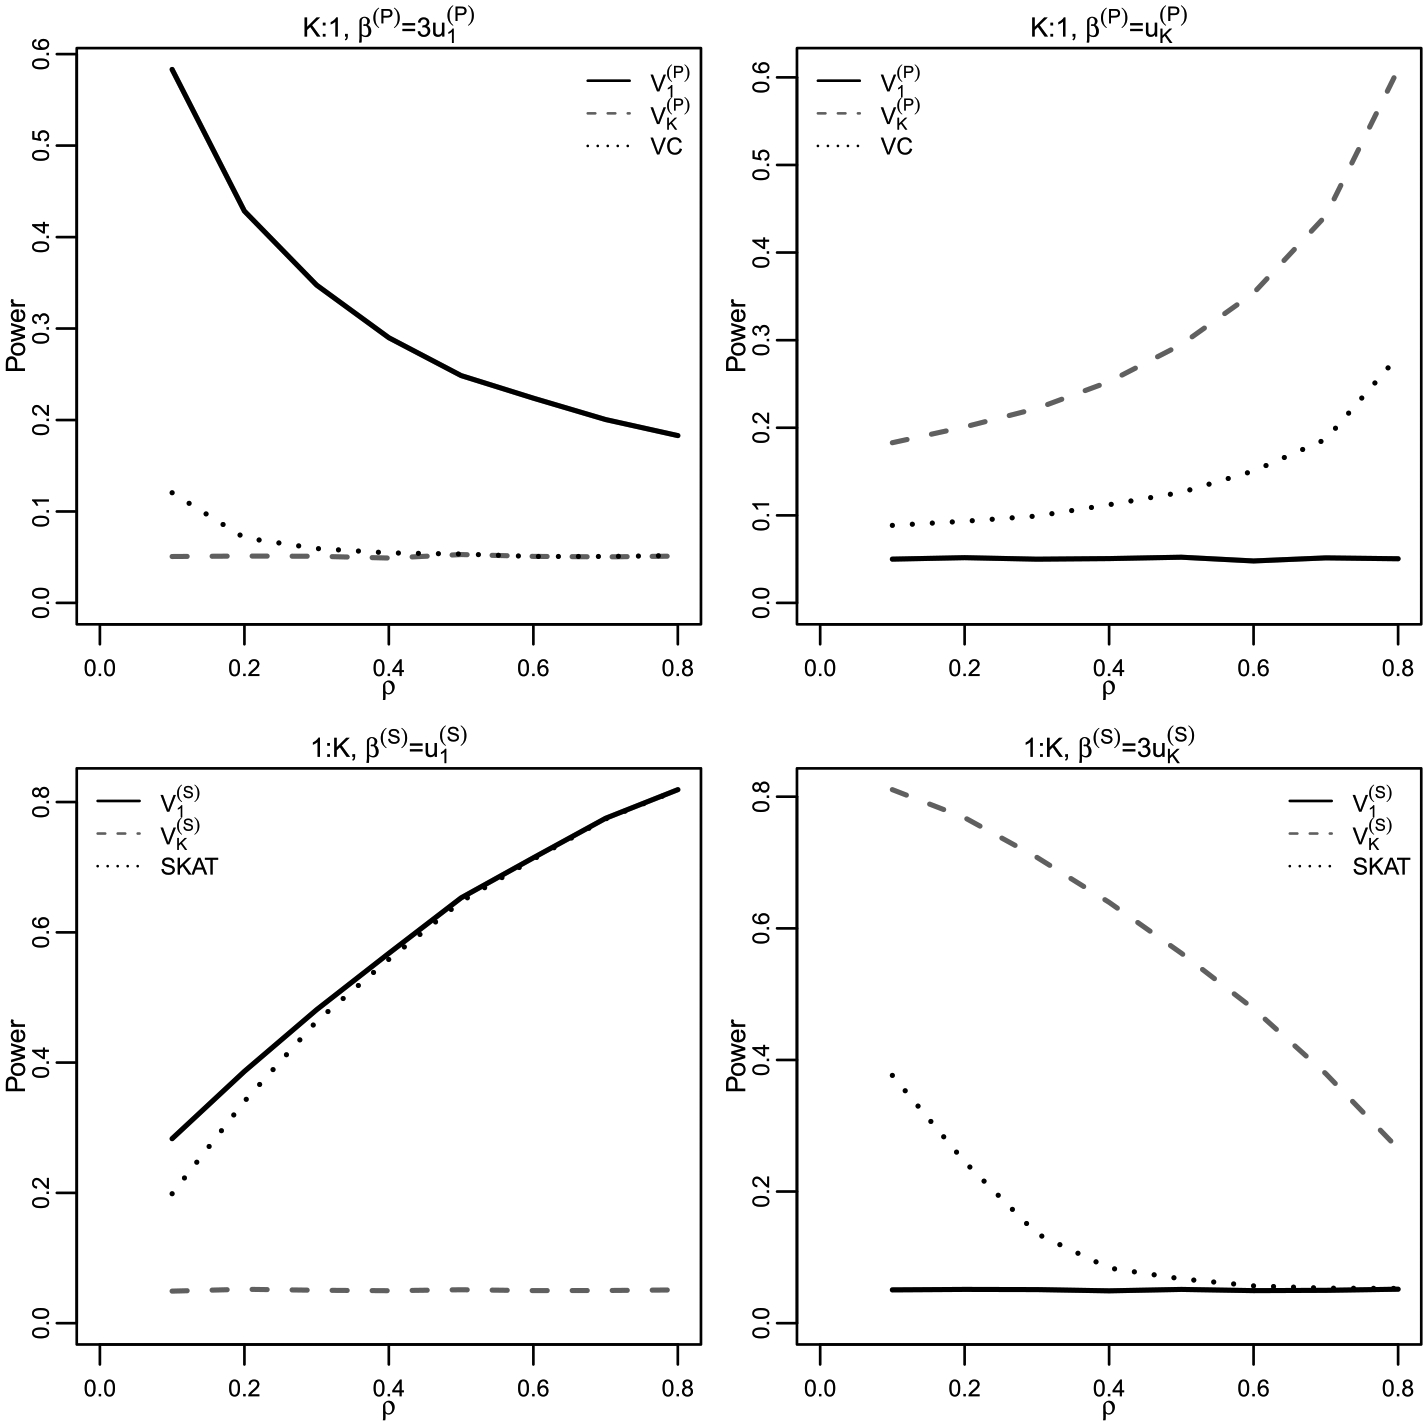
Fig. 1.

Power simulations demonstrating the relationship between PC tests and variance component tests. Set , and consider the exchangeable correlation structure with a varying correlation coefficient . For each (and ) and each , 105 simulations are used to estimate the power of each method empirically.
