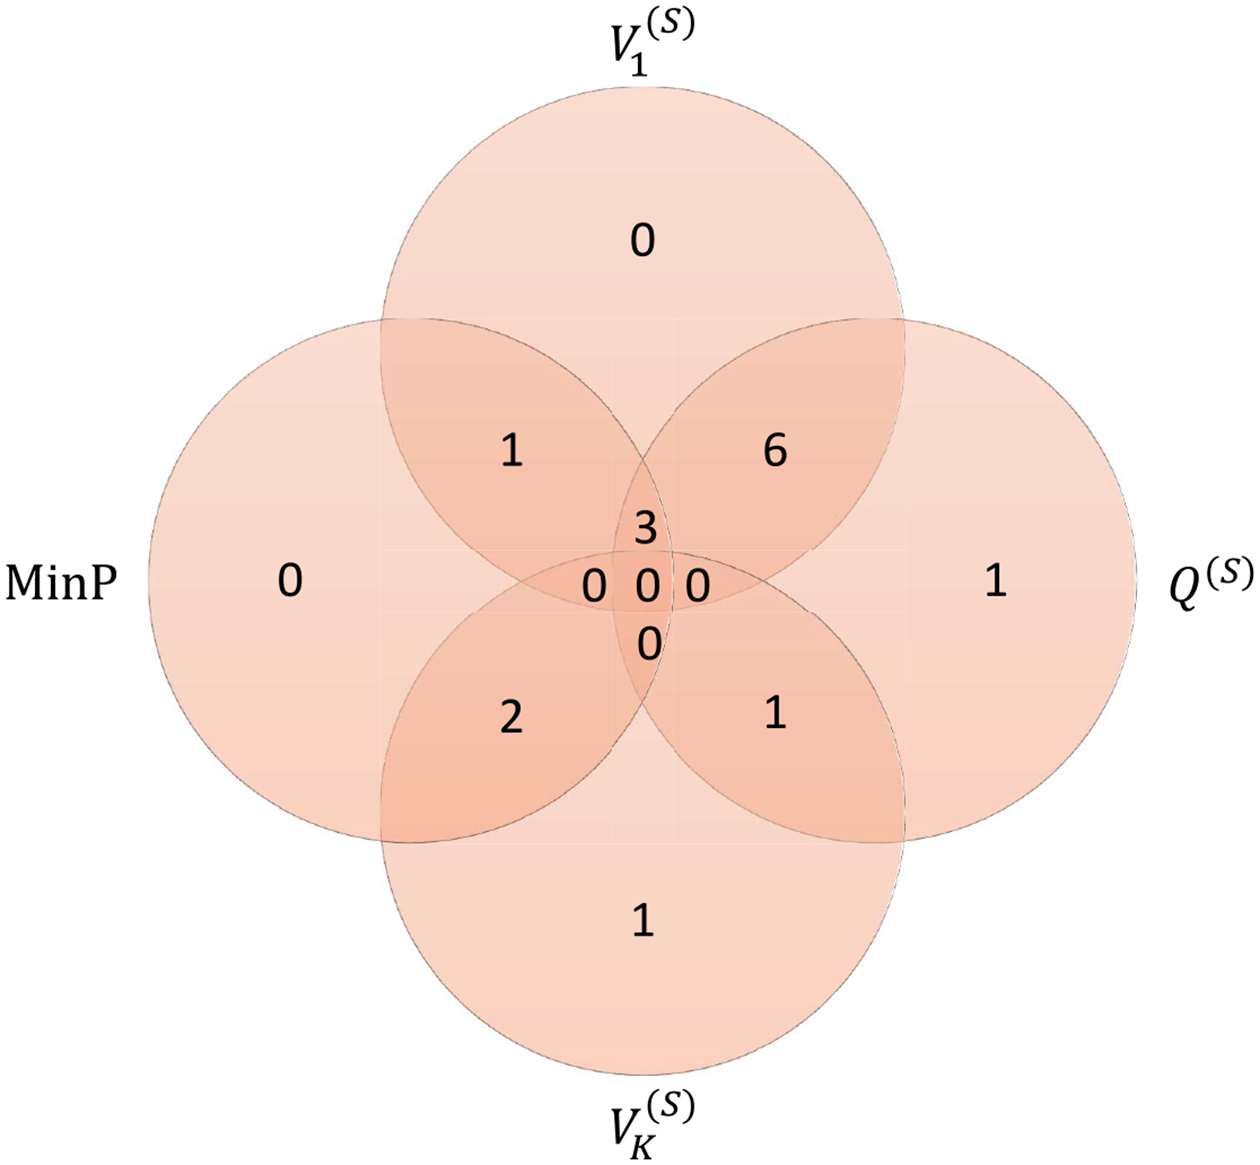
Fig. 5.

Venn Diagram for 1:K method similarity in the detection of the top genes in the breast cancer GWAS. The top 15 genes were determined by sorting the smallest p-values of all four methods: first and last PCs, SKAT and MinP. Among these genes, -values less than 10−3 were counted for each method to produce the diagram.
