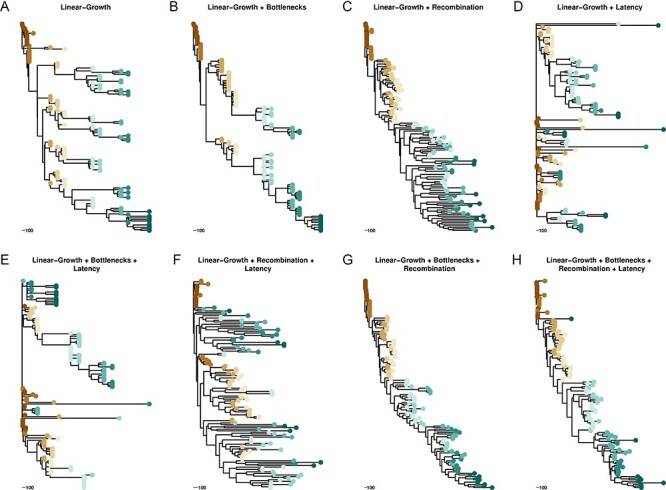
Figure 3.

Illustration of effects of within-host evolutionary processes on virus phylogenies. Each tree is the decomposed average tree from one ARG simulation of 12 years using 132 sampled taxa spread over ten sampling events. Color represents tips sampled at the same time. The baseline model, a linear-growth coalescent model is in Panel A. Panels B-H illustrate the effect of the processes listed at the top of each panel. For simulations in which the process is active:  and
and  ; λ = 1.31; and ρ = 0.01. Trees are all on the same scale (days).
