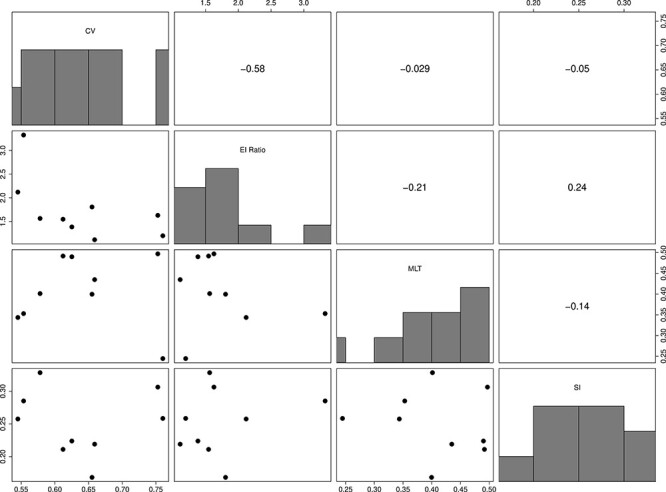
Figure 5.

Tree statistic probe values for the nine patients. These statistics were used to match simulations to the patient observed HIV-1 phylogenies. The lower left scatter plots depict the values of each corresponding row and column metrics for each patient. The diagonal is a histogram of the statistic values across the nine patients. The upper right triangle gives the correlation of the corresponding row and column metrics. The CV captures the relative variability in the pairwise distance of tips from the same sampling event, the EI ratio describes the relative differences between external and internal branches, the MLT calculates the mean number lineages of lineages in a clade with extant descendants across sample times, and the SI is an indicator of tree balance. We used an additional statistic, the RPD; however, we do not depict it here as it is a relational metric calculated directly between a simulated distance matrix and the observed empirical distance matrix.
