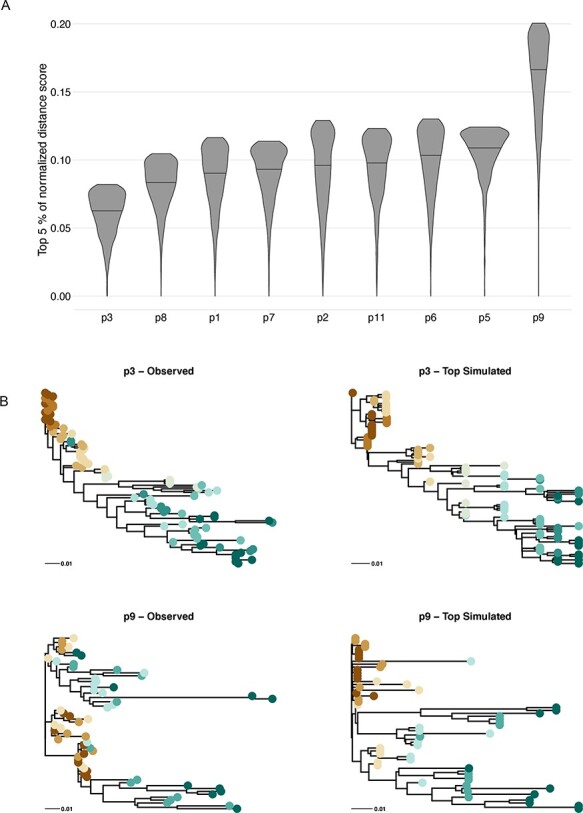
Figure 6.

Normalized distance scores of the best-fitting 5 per cent of simulations for each patient. Panel (A) shows the density of the best-fitting 5 per cent of 31,100 distance scores normalized for each patient, with the best-fitting match receiving a score of 0 and the worst-fitting match receiving a score of 1. Patients are ordered by the mean of the normalized top scores. Panel (B) illustrates the variation in quality of model fits by showing the observed and single best simulation for Patients 3 and 9. The simulated trees are scaled from time to genetic distance by the optimal evolutionary rate found when calculating the RPD.
