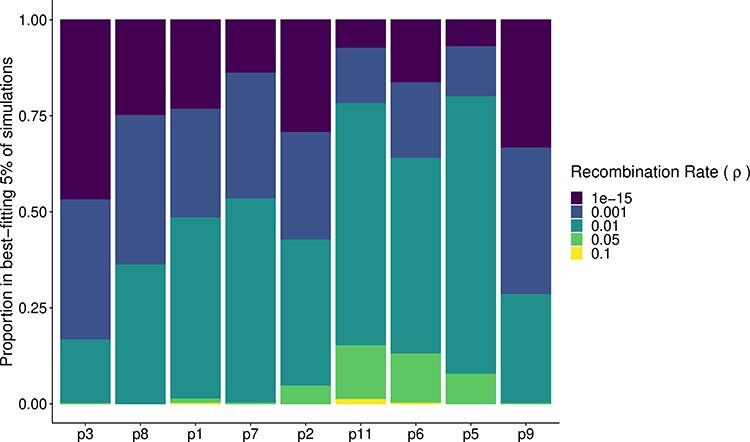
Figure 7.

The recombination breakdown within the best-fitting 5 per cent of simulations for each patient. For this figure, we bootstrapped the scores within each recombination strata so that each stratum contained 10,000 values. For each bootstrap replicate, we normalized the score across the 50,000 samples and calculated the relative frequency of each recombination rate in the top 5 per cent of matching simulations. Here, we plot the mean relative frequency of each recombination strata over 100 bootstrap replicates. Patients are organized by the mean of the normalized top scores, with Patient 3 having the lowest (best-fitting) mean score.
