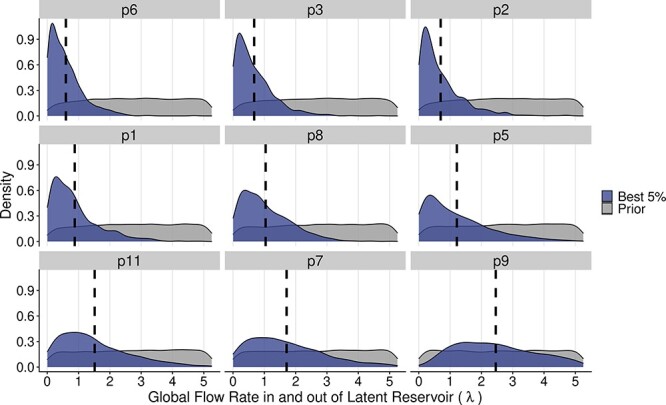
Figure 8.

Marginal distributions of the global flow rates in and out of the latent reservoir across the nine patients. Colors distinguish the density of parameters between simulations with the best-fitting 5 per cent of distance scores (blue) and the highest 95 per cent of distance scores (gray). The dashed line indicates the mean of λ for the best 5 per cent distribution. Patients are ordered by increasing values of λ of the best-fitting 5 per cent of simulations. This figure represents the results of one of the bootstrap replicates.
