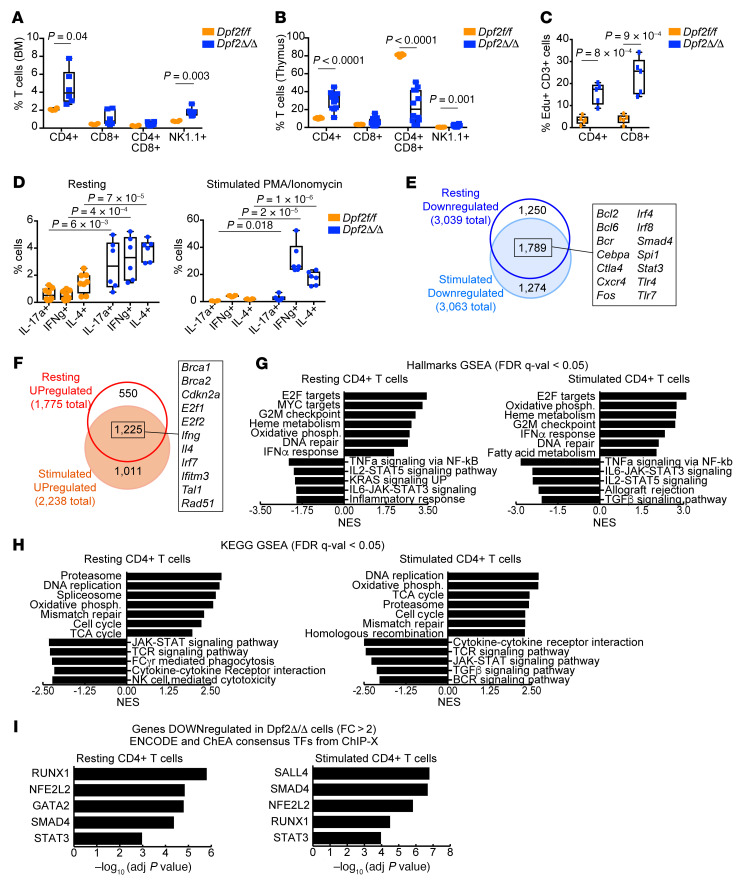
Figure 3. Absence of Dpf2 leads to the expansion and increased cytokine production of T cell populations.
(A) Frequency of CD3+ T and NK cells (CD3–NK1.1+) in BM of 28-day-old mice. (B) Same as A, but in the thymus. (C) Percentage of EdU+CD3+ splenic T cell populations. (D) Flow cytometric analyses of intracellular cytokines expressed from sorted CD4+ T cell subsets after stimulation. (E) Overlap between genes downregulated after Dpf2 loss in resting or stimulated CD4+ T cells (q < 0.05, fold change >2). Highlighted are a few of the 1,789 genes downregulated after Dpf2 loss in both conditions. (F) Same as in E, but for genes that were upregulated. (G) Hallmark GSEA of gene expression programs enriched in Dpf2Δ/Δ compared with Dpf2fl/fl CD4+ T cells. (H) KEGG GSEA of pathways enriched in Dpf2Δ/Δ CD4+ T cells. (I) ENCODE and ChEA consensus TFs from ChIP coupled with high-throughput techniques (ChIP-X) analysis obtained from genes that were downregulated (q < 0.05, fold change >2) in Dpf2Δ/Δ compared with Dpf2fl/fl CD4+ T cells. Plots represent the mean ± SEM. P values were calculated using a 2-tailed, unpaired Student’s t test except for panel D, which was calculated using 2-way ANOVA. Absence of a P value indicates a nonsignificant difference.

