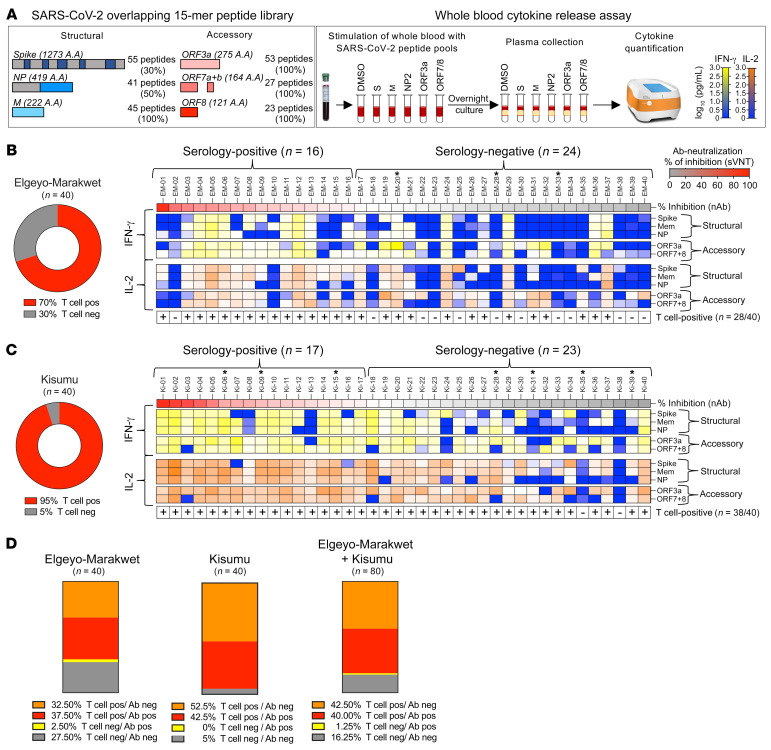
Figure 2. T cell response specific for different SARS-CoV-2 proteins in asymptomatic participants from Elgeyo Marakwet and Kisumu.
(A) Schematic representation of the 5 SARS-CoV-2–specific peptide pools containing 15 mer overlapping peptides spanning 30% of spike (S), entire membrane (M), and 50% NP, and complete accessory proteins ORF3a and ORF7/8 that were used in 18-hour whole-blood cultures. Levels of IFN-γ and IL-2 secreted in response to peptide stimulation were quantified in the plasma of the blood cultures. If peptide stimulation induced greater than 5 pg/mL cytokines (IFN-γ and/or IL-2) above the corresponding DMSO controls with 2 distinct peptide pools, the individual was considered positive for SARS-CoV-2–specific T cells. The percentages of individuals from (B) Elgeyo Marakwet and (C) Kisumu who were positive for SARS-CoV-2–specific T cells are shown in red. Heatmaps show the levels of cytokines (yellow to blue: IFN-γ; orange to blue: IL-2) released upon stimulation with the distinct peptide pools in each individual; HIV-positive individuals are indicated by a single asterisk (*); samples considered positive for T cells are indicated by a plus sign (+). Participants’ data are organized according to the level of neutralizing antibodies. (D) Percentage of individuals who tested positive or negative for SARS-CoV-2–specific T cells and neutralizing antibodies. Mem, membrane; ORF7+8, ORF7 and ORF8; pos, positive; neg, negative.

