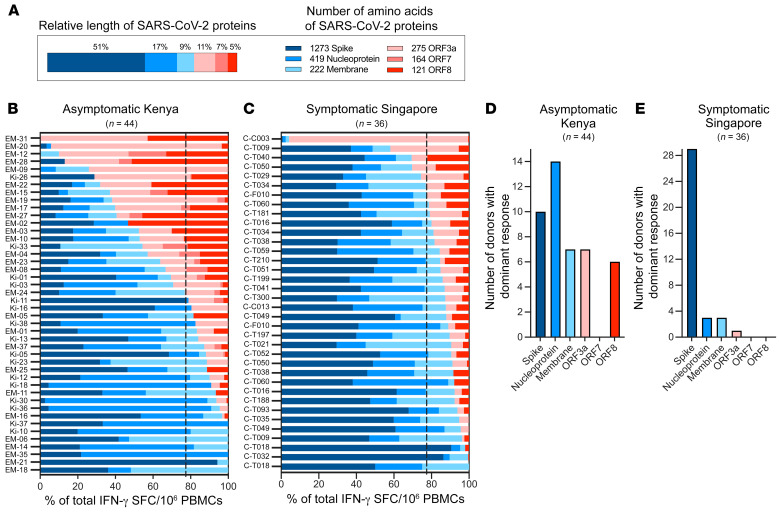
Figure 4. Immunodominance hierarchy of T cell responses to structural and accessory proteins of SARS-CoV-2.
(A) Schematic representation of the relative length of the 6 different SARS-CoV-2 proteins tested (left) and their number of amino acids (right). (B) The SARS-CoV-2 T cell response composition in each responding asymptomatic participant from Kenya (n = 44) is shown as a percentage of the total detected response (structural proteins are shown in shades of blue; accessory proteins are shown in shades of red). The dotted line represents the relative length of the structural (77%) and accessory proteins (23%) tested. (C) The composition of the SARS-CoV-2 response in convalescent symptomatic COVID-19 patients from Singapore (n = 36) is shown as a percentage of the total detected response. The number of participants with a dominant T cell response to the indicated SARS-CoV-2 proteins is shown for samples from asymptomatic participants from Kenya (D) and symptomatic convalescent COVID-19 patients from Singapore (E).

