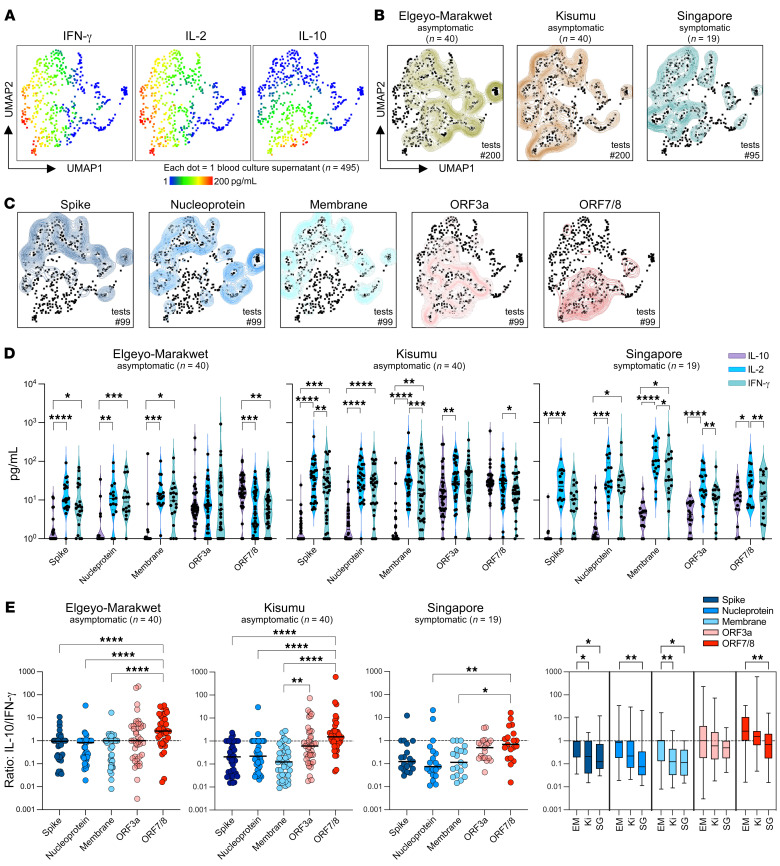
Figure 5. Cytokine secretion profile of SARS-CoV-2 peptide pool–stimulated whole blood from asymptomatic Kenyans and symptomatic convalescent Singaporeans.
Whole blood was stimulated with SARS-CoV-2 peptide pools overnight, and the cytokine secretion profile (IFN-γ, IL-2, and IL-10) was analyzed using an unsupervised clustering algorithm UMAP. (A) UMAP plots with cytokine secretion heatmaps. (B) Concatenated cytokine secretion profiles from asymptomatic participants from Elgeyo Marakwet (left, green, n = 40 individuals, n = 200 tests) and from Kisumu (middle, brown, n = 40 individuals, n = 200 tests), and convalescent symptomatic COVID-19 patients from Singapore (right, blue, n = 19 individuals, n = 95 tests) overlaid on the global UMAP plot of all analyzed samples (black dots; each dot corresponds to 1 culture supernatant). (C) UMAP plots comparing the cytokine secretion profiles of whole blood from all individuals tested (n = 99) stimulated with the 5 different SARS-CoV-2 peptide pools shown individually. (D) Violin plots showing the quantity of IL-10, IL-2, and IFN-γ detected in the different culture supernatants from asymptomatic participants from Elgeyo Marakwet (left) and Kisumu (middle) and from symptomatic convalescents from Singapore (right). Friedman’s test followed by Dunn’s multiple-comparison test (line indicates the median). (E) Ratios of IL-10/IFN-γ quantities detected in the culture supernatants stimulated with the different peptide pools. (F) Ratios of IL-10/IFN-γ quantities detected in the culture supernatants stimulated with the different peptide pools are compared between the 3 cohorts. EM, Elgeyo Marakwet; Ki, Kisumu; SG, Singapore. (E and F) Kruskal-Wallis test, followed by Dunn’s multiple-comparison test (line indicates the median). *P < 0.05, **P < 0.01, ***P < 0.001, and ****P < 0.0001.

