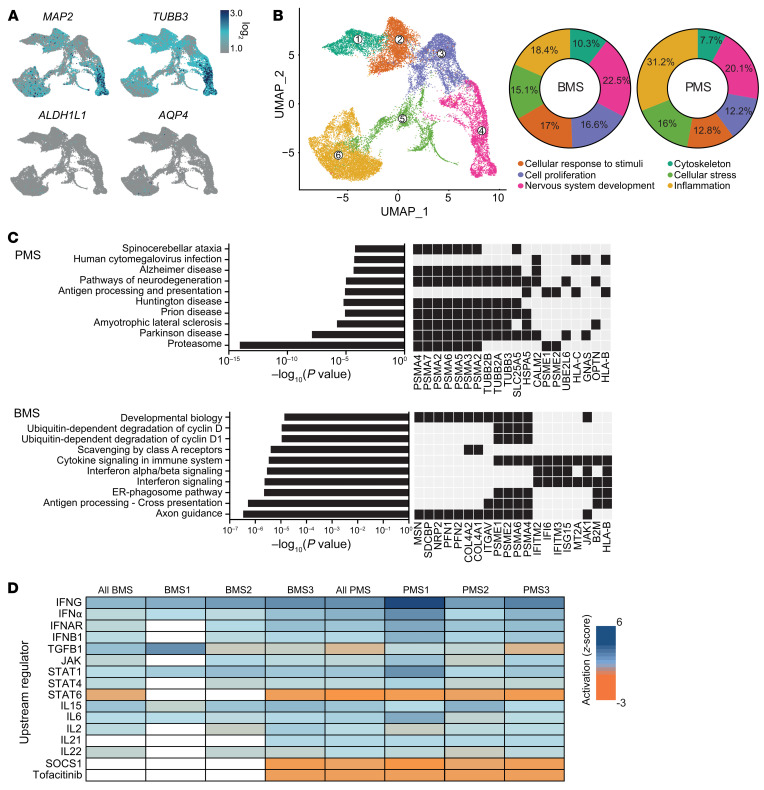
Figure 4. Single-cell transcriptome analysis of MS patient astrocyte/NGN2 neuron cocultures.
Cells were treated for 24 hours with TNF-α/IL-17A or left untreated (control) and harvested with Accutase. Single-cell suspensions of 6 technical repeats per sample were filtered, and subsamples were labeled with CMOs to allow pooling for multiplexed libraries. (A) UMAP of all cells with projection of expression of MAP2 and TUBB3 (neuronal markers) and ALDH1L1 and AQP4 (astrocyte markers). (B) UMAP and pie chart to analyze the proportional distribution of cells in the color-coded subclusters, which were named according to the most prevalent defining genes (ranked by log2 fold change) and their prospective function. Neurons of PMS cultures were found to be higher in the inflammation cluster compared with BMS. (C) Enrichr analysis of KEGG 2021 and Reactome 2016 pathways comparing PMS and BMS. A black box represents the presence of a gene. (D) IPA analysis comparing samples according to potential upstream mediators (short list; for complete analysis see Supplemental Table 1). The z score represents the activation score of a predicted regulator based on the expression of the input genes; a positive score represents an activation and a negative score an inhibition. Each column of BMS or PMS represents the data set of 1 experiment (TNF-α/IL-17A treated vs. control); “all BMS” and “all PMS” are the mean of samples BMS1–BMS3 or PMS1–PMS3, respectively. The analysis predicted a JAK/STAT activation and a negative score for tofacitinib in all PMS samples.

