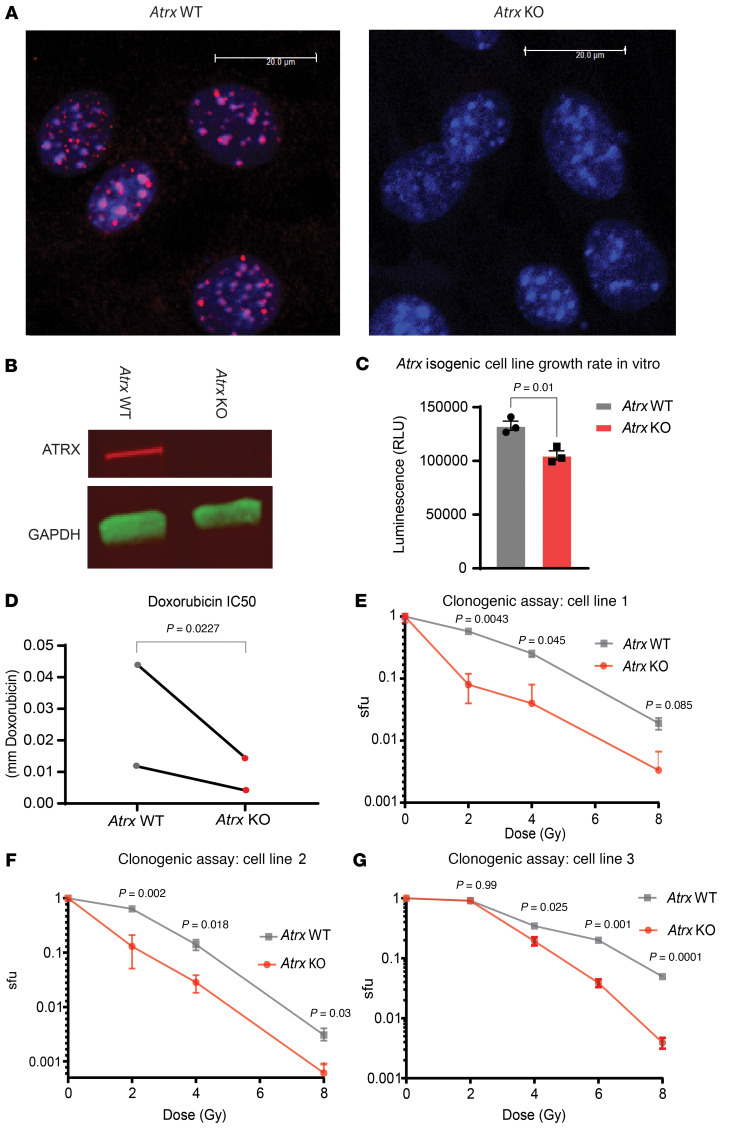
Figure 3. Atrx deletion increases sensitivity to DNA DSB-inducing therapeutics.
(A) Immunofluorescence staining for ATRX (red) in isogenic cell lines derived from single cells after transfection with Cas9 and either a vector only control (left, “Atrx WT”), or a sgRNA to Atrx (right, “Atrx KO”). DAPI staining of nuclei in blue. Representative images, experimental validation of CRISPR mediated Atrx knockout repeated for each isogenic Atrx cell line pair used in this study. (B) Western blot of ATRX and GAPDH in Atrx WT and Atrx KO cell lines using LICOR Odyssey Imager with chemiluminescent secondary antibodies. Representative images, experimental validation of CRISPR mediated Atrx knockout repeated for each isogenic Atrx cell line pair used in this study. Colors are generated by fluorescent secondary antibodies, red bound to ATRX primary antibody, green bound to GAPDH primary antibody. (C) Growth assay for Atrx WT and Atrx KO cell lines, performed in triplicate and measured using Cell Titer Glo 2.0. Statistical analysis using unpaired 2-tailed t test. (D) IC50 assays in which Atrx isogenic cell line pairs (n = 2) were treated with the DNA DSB-inducing therapeutic doxorubicin. Statistical analysis was performed using a ratio paired t test. Each data point represents a biological replicate. (E–G) Clonogenic assay of isogenic Atrx deleted and intact cell line pairs after the indicated doses of ionizing radiation. Surviving fraction (sfu) is shown in log scale on the y-axis. Statistical analysis was performed using multiple Welch’s t tests corrected for multiple comparisons using the Holm-Šídák method. Each graph represents a separate biological replicate isogenic cell line pair.

