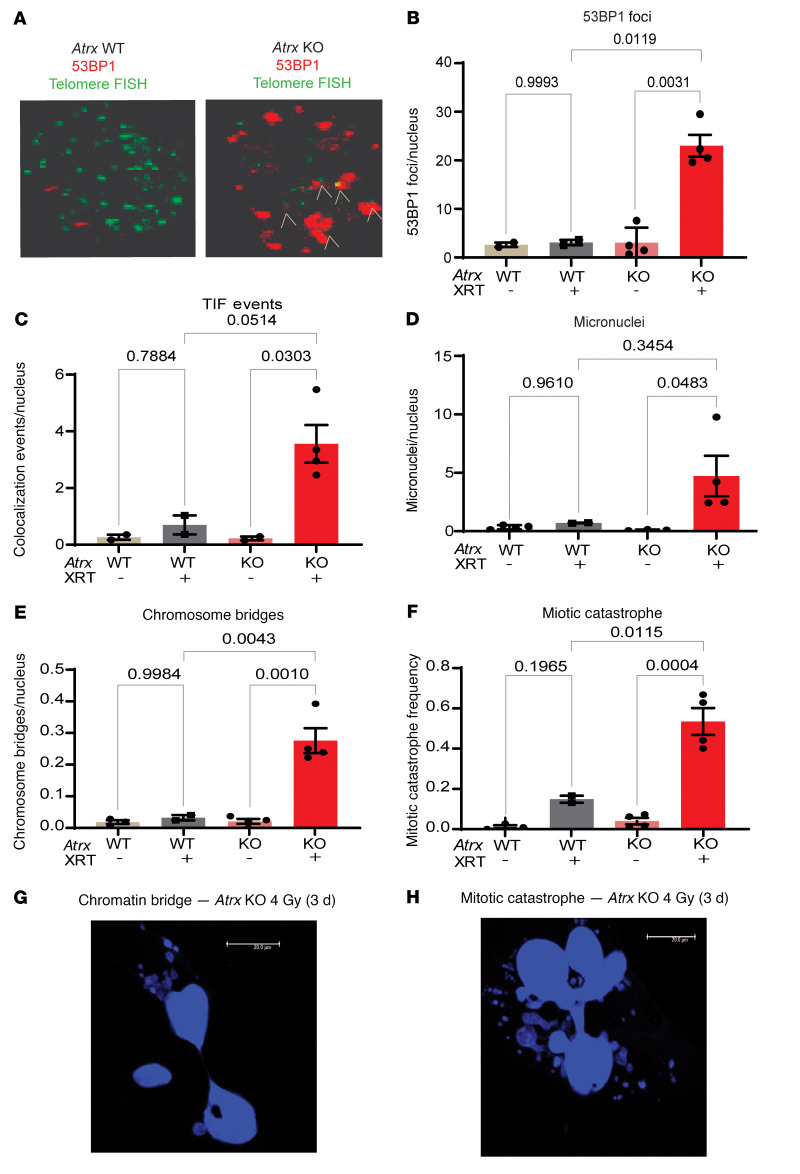
Figure 4. Atrx deletion leads to persistent DNA DSBs and telomere dysfunction after irradiation.
(A) Representative images showing 53BP1 Foci (red) and telomere foci (green) in Atrx WT (left) and Atrx KO (right) cell lines 3 days after 4 Gy. White markers show colocalization of telomere FISH foci and 53BP1 foci, which are TIF. Representative images from experiments detailed in C. (B–F) Quantification of an Atrx isogenic cell line pair assayed 3 days after 4 Gy. Each dot represents an experimental repeat immunoFISH experiment of a single isogenic cell line pair with at least 7 images quantified for each experiment. Replicates are Atrx KO + IR (n = 4); Atrx KO untreated (n = 4); Atrx WT + IR (n = 2); and Atrx WT untreated (n = 3). Data are shown for 53BP1 foci (B), 53BP1 and telomere FISH colocalization marking TIFs (C), micronuclei (D), persistent chromosomal bridges between cells (E), and mitotic catastrophe (F). Statistical analysis was performed using a 2-way ANOVA with Tukey’s multiple comparisons test (B–F). (G) DAPI staining showing a chromatin bridge in an Atrx KO cell line treated with 4 Gy and assayed 3 days later. (H) DAPI staining showing a cell undergoing mitotic catastrophe in an Atrx KO cell line treated with 4 Gy and assayed 3 days later. Representative images from experiments detailed in F.

