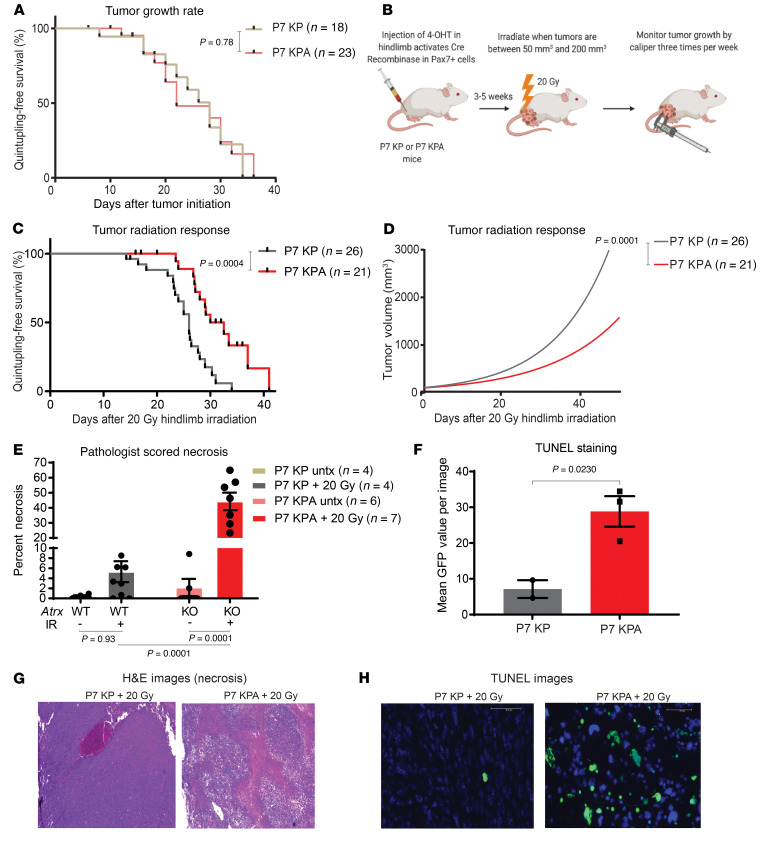
Figure 5. Atrx deletion increases radiosensitivity in vivo.
(A) Tumor growth rates of sarcomas that retained Atrx in P7 KP mice (n=18) and sarcomas with deleted Atrx in P7 KPA mice (n = 23) as measured by time for tumor to quintuple in size relative to size at initial measurement. Comparison of survival curves was performed using log-rank (Mantel Cox) test. (B) Diagram summarizing experimental procedure for mouse sarcoma irradiation and monitoring. (C) Measurement of P7 KP (n = 26) and P7 KPA (n = 21) tumor growth rates after 20 Gy hindlimb irradiation, as measured by time for tumor to quintupling in size relative to size at treatment. Comparison of survival curves was performed using log-rank (Mantel Cox) test. (D) Nonlinear fit modeling of tumor growth curves for P7 KP (n = 26) and P7 KPA (n = 21) sarcomas after 20 Gy hindlimb irradiation. (E) Quantification of pathologist-scored percent area necrosis of samples that were either untreated (lighter colors) or treated with 20 Gy (darker colors) and harvested at 6 days. Each data point represents a biological replicate, and the number of samples for each arm is as annotated in figure legend, error bars showing SEM. Statistical analysis was performed using a 2-way ANOVA with Tukey’s multiple comparisons test. (F) Quantification of TUNEL positive fluorescence in frozen sections of P7 KP (n = 2) and P7 KPA (n = 3) tumor samples harvested 3 days after 20 Gy of hindlimb radiation. Each data point represents a biological replicate. Statistical comparison utilized an unpaired 2-tailed t test with Welch’s correction. (G) Representative H&E staining from sarcomas in P7 KP (left) and P7 KPA (right) mice harvested 6 days after 20 Gy. Images were scored for necrosis by a sarcoma pathologist. (H) Representative TUNEL staining from sarcomas from P7 KP (left) and P7 KPA (right) mice harvested 3 days after 20 Gy. GFP positive cells are TUNEL positive. Scale bar: 50 μm.

