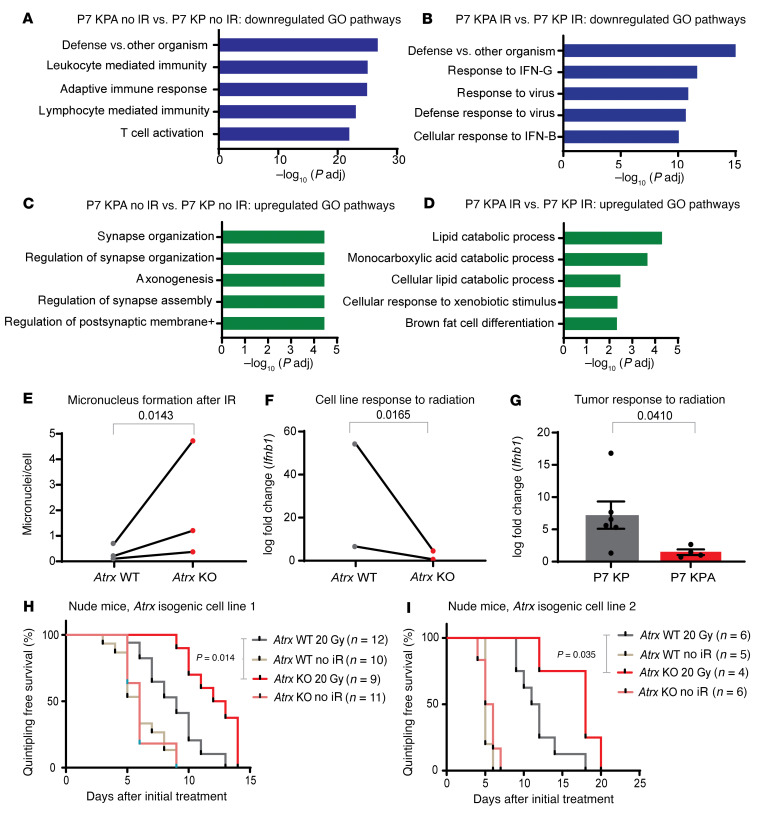
Figure 6. Atrx deletion radiosensitizes STS in a T cell–independent manner. (A)Top.
5 downregulated pathways for RNA-Seq GO pathway enrichment analysis comparing unirradiated P7 KPA sarcomas (n = 4) and unirradiated P7 KP sarcomas (n = 4). (B) Top 5 downregulated pathways for RNA-Seq GO pathway enrichment analysis comparing P7 KPA sarcomas harvested 6 days after treatment with 20 Gy ionizing radiation (n = 4) and P7 KP sarcomas harvested 6 days after treatment with 20 Gy ionizing radiation (n = 8). (C) Top 5 upregulated pathways for RNA-Seq GO pathway enrichment analysis comparing unirradiated sarcomas in P7 KPA mice (n = 4) and unirradiated sarcomas in P7 KP mice (n = 4). (D) Top 5 upregulated pathways for RNA-Seq GO pathway enrichment analysis comparing sarcomas in P7 KPA mice harvested 6 days after treatment with 20 Gy ionizing radiation (IR) (n = 4) and sarcomas in P7 KP mice harvested 6 days after treatment with 20 Gy IR (n = 8). (E) Quantification of micronuclei for cell lines analyzed 3 days after treatment with 4 Gy. Each dot represents a biological replicate, and each biological replicate had at least 5 separate fields scored. For statistical analysis, a ratio paired 2-tailed t test was performed, pairing each Atrx KO cell line (n = 3) to its Atrx WT isogenic cell line (n = 3) counterpart. (F) RT-PCR quantification of log fold–change expression of Ifnb1 of isogenic cell lines assayed 3 days after 4 Gy of ionizing radiation. For statistical analysis, a ratio paired t test was performed, pairing each Atrx KO cell line (n = 2) to its Atrx WT isogenic cell line (n = 2) counterpart. (G) RT-PCR quantification of log fold–change expression of Ifnb1 of sarcomas from P7 KP (n = 6) and P7 KPA (n = 4) mice harvested 6 days after treatment with 20 Gy of ionizing radiation relative to its untreated control. Statistical comparison utilized an unpaired t test with Welch’s correction (H and I) A single cell line from 1 of 2 Atrx isogenic cell line pairs was implanted into the hindlimb muscle of nude T cell–deficient mice. Once tumors formed, mice were randomized to receive radiation therapy or no treatment. Number of tumors for each experimental arm are as shown in the figure legend. Survival curves were estimated for each group, considered separately, using the Kaplan-Meier method, and compared statistically using the log-rank (Mantel Cox) test.

