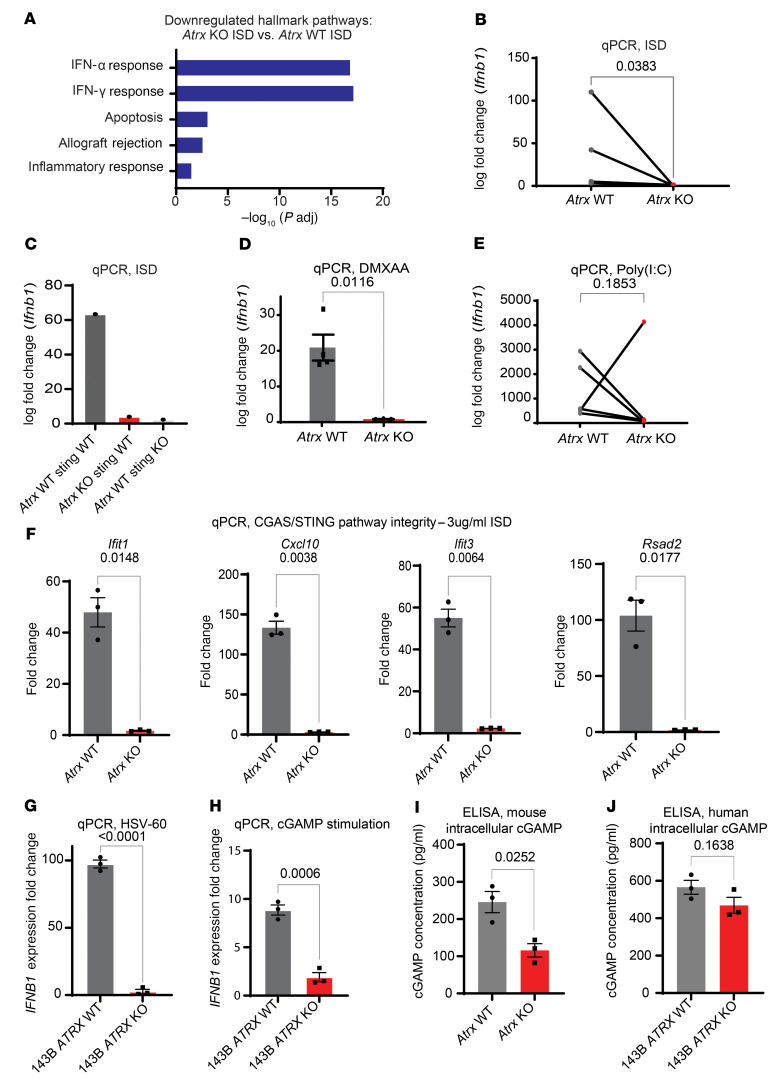
Figure 7. Atrx deletion suppresses type I IFN signaling in a CGAS/STING-dependent manner.
(A) Hallmark pathway gene set enrichment analysis of RNA-Seq data comparing 3 Atrx KO isogenic cell lines treated with ISD to 3 Atrx WT isogenic cell lines treated with ISD. (B) RT-PCR of Ifnb1 for Atrx WT (n = 3) and Atrx KO (n = 3) isogenic cell line pairs transfected with ISD at a concentration of 3 μg/mL and harvested 24 hours after treatment. Statistical analysis was performed using a ratio paired t test. All data points represent biological replicates. (C) RT-PCR quantification of Ifnb1 expression after ISD stimulation for an Atrx WT and Sting WT sarcoma cell line without or with CRISPR-mediated knockout of Atrx alone or Sting alone. These experiments were performed using 3 technical replicates per experimental condition and the resulting log fold–change value is shown. (D) RT-PCR of Ifnb1 for Atrx isogenic cell line pair 1 treated for 24 hours with 100 μg/mL DMXAA, a potent STING agonist and cGAMP analogue. Each dot represents a separate experimental repeat of the RT-PCR assay (n = 4 per arm). Statistical analysis was performed using an unpaired t test with Welch’s correction. (E) RT-PCR of Ifnb1 for Atrx isogenic cell line pairs (n = 4) treated with Poly(I:C) at a concentration of 1 μg/mL and harvested at 24 hours. Statistical analysis was performed using a ratio paired t test. All data points represent biological replicates. (F) RT-PCR quantification of 4 other ISGs downstream of the CGAS pathway for Atrx isogenic cell line pairs (n = 3) harvested 24 hours after transfection with ISD. Statistical analysis was performed using an unpaired t test with Welch’s correction. (G) RT-PCR quantification of IFNB1 for the 143B human sarcoma cell line with or without ATRX KO harvested 24 hours after treatment with oncolytic herpesvirus HSV-60 DNA. Each dot represents a separate experimental repeat of the RT-PCR assay (n = 3 per arm). Statistical analysis was performed using an unpaired t test with Welch’s correction. (H) RT-PCR of IFNB1 for 143B human sarcoma cell line with or without ATRX KO treated for 24 hours with 100 μg/mL cGAMP. Each dot represents a separate experimental repeat of the RT-PCR assay (n = 3 per arm). Statistical analysis was performed using an unpaired t test with Welch’s correction. (I and J) ELISA for cGAMP was performed using either mouse (I) or human (J) ATRX isogenic cell lines in triplicate. Raw values were fit to a standard curve with the use of the ELISATriple Plate software from Cayman. Each dot represents a technical replicate of the experiment, error bars showing SEM. Statistical analysis was performed using an unpaired t test with Welch’s correction for both I and J.

