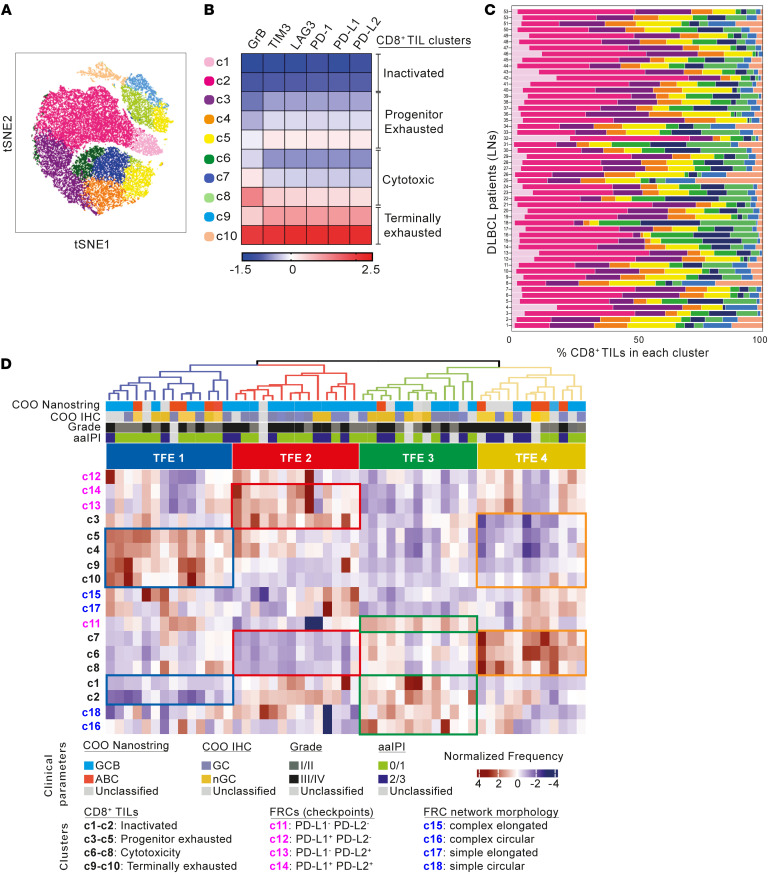
Figure 10. IMC reveals distinct CD8+ TFEs in DLBCL.
(A) t-SNE plot of CD8+ TILs from 53 DLBCL-LN core biopsies (2 per patient tissue) (IMC). TILs are clustered based on the expression of PD-1, LAG-3, TIM-3, PD-L1, PD-L2, and GrB. (B) Heatmap of the median normalized protein expression per CD8+ cluster (c1–c10) and associated phenotypic identities indicated. (C) Frequency distribution of the identified CD8+ clusters across the 53 DLBCL-LNs (TMA patient IDs shown). (D) Hierarchical clustering of DLBCL patient data (n = 53) based on the z-scored frequency of each CD8+ TIL cluster (c1–c10), FRC PD-1 ligand expression cluster (c11–c14) (Supplemental Figure 7J), and FRC morphological shape cluster (c15–c18) (Supplemental Figure 1H). Four CD8+ TFEs (TFE1–4) are indicated at the top of the heatmap.

