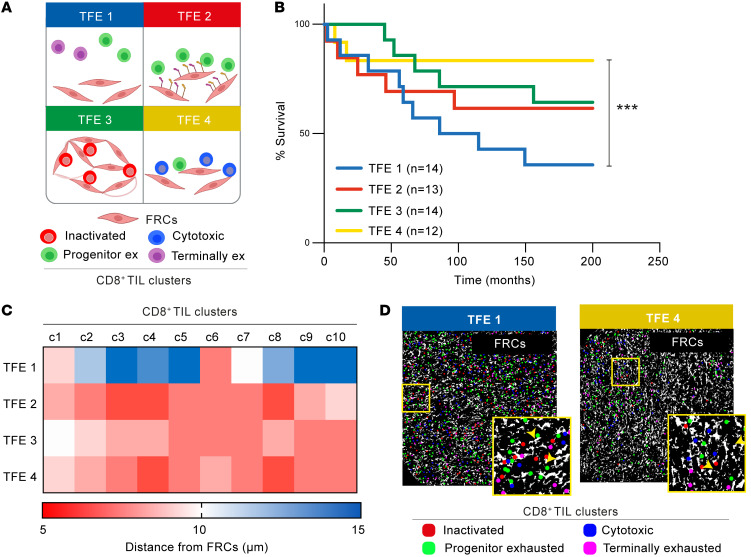
Figure 11. CD8+ TIL/FRC spatial organization associates with survival outcome in DLBCL.
(A) TFEs in the DLBCL-LN TMA schematic. CD8+ TIL phenotypic identities: inactivated (red), progenitor exhausted (green), cytotoxic (blue), and terminally exhausted (purple). (B) Kaplan-Meier curves of overall survival for each identified TFE (n = number of patients per TFE group). (C) Heatmap showing the average distance of each CD8+ cell (within CD8+ TIL clusters, c1–c10) from the FRC network for each TFE. (D) Two representative DLBCL-LN samples belonging to TFE 1 and TFE 4, showing the FRC mask (white) and the center of each CD8+ phenotypic cluster: inactivated (red), progenitor exhausted (green), cytotoxic (blue), terminally exhausted (pink). Original magnification, ×20. (B) ***P < 0.001, log-rank (Mantel-Cox) test.

