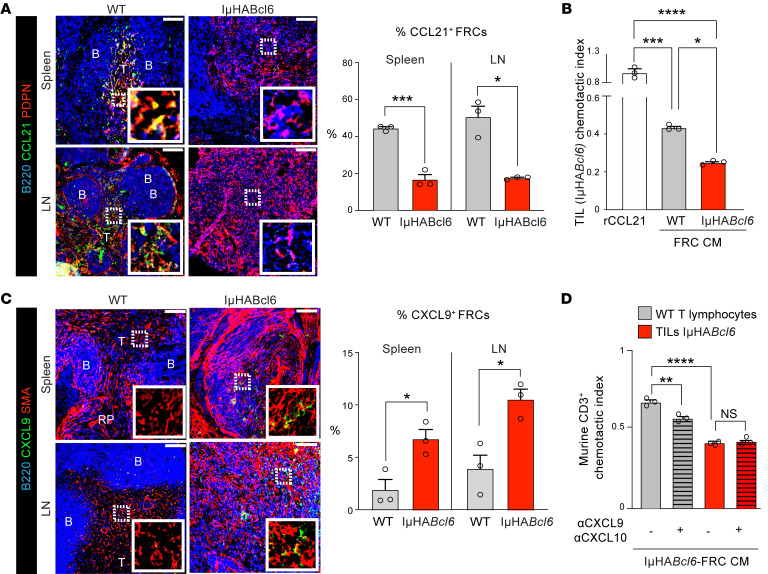
Figure 6. DLBCL-FRCs show a reduced ability to attract TILs.
(A) Images of stained WT (n = 3) and IμHABcl6 (n = 3) spleens and LNs. Scale bars: 100 μm. B, B cell zones; T, T cell zones. Graph shows percentages of CCL21+ FRCs. (B) TIL (IμHABcl6) chemotaxis toward recombinant CCL21, CM from WT-FRCs, or IμHABcl6-FRCs. (C) Images of stained WT (n = 3) and IμHABcl6 (n = 3) spleens and LNs. Scale bars: 100 μm. Graph shows percentages of CXCL9+ FRCs. (D) WT T lymphocyte TIL (IμHABcl6) chemotaxis toward IμHABcl6-FRCs CM with isotype (–) or CXCL9/CXCL10–neutralizing antibodies (+). (B and D) One experiment from n = 5 (B) or n = 3 (D) independent sample experiments. Data are represented as mean ± SEM (A–D). *P < 0.05; **P < 0.01; ***P < 0.001; ****P < 0.0001, 1-way ANOVA with Tukey’s test (B and D) or Mann-Whitney U test (A and C).

