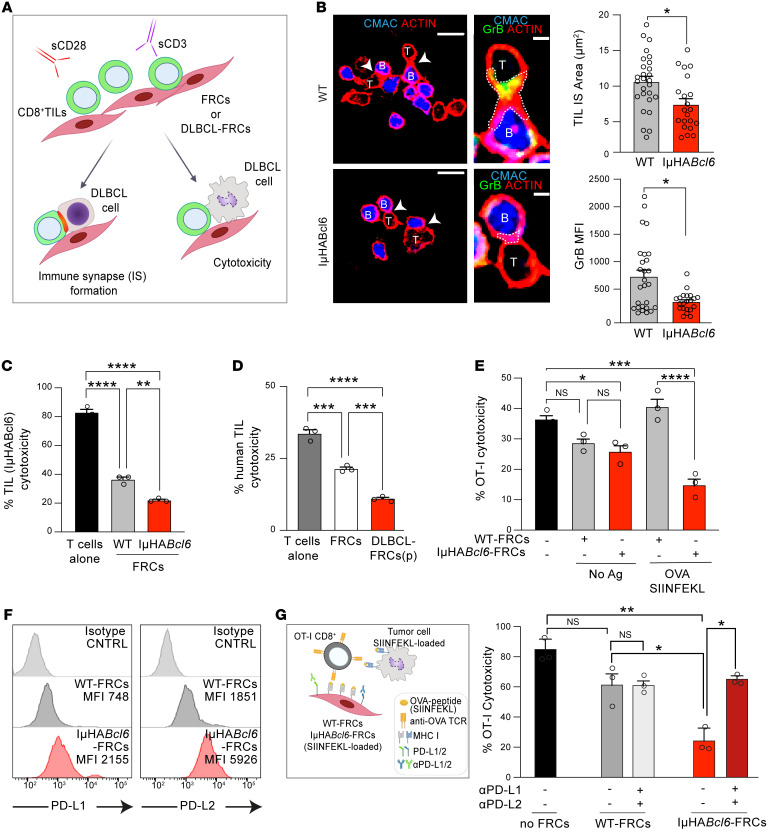
Figure 8. DLBCL-FRCs dampen CD8+ TIL killing function.
(A) Autologous assay schematic assessing CD8+ TIL antitumor activities following exposure (24 hours) to DLBCL-FRCs or FRCs. (B) CD8+ TIL (IμHABcl6) (T) and DLBCL B cells (B) immune synapse following the exposure of TILs to WT-FRCs or IμHABcl6-FRCs. Scale bars: 100 μm; 25 μm (magnified). CD8+ TIL:DLBCL F-actin+ immune synapse (IS) area and GrB MFI. (C) TIL (IμHABcl6) cytotoxicity against DLBCL B cells. TILs activated alone or with WT-FRCs or IμHABcl6-FRCs. (D) Human anti-DLBCL TIL cytotoxicity. TILs activated alone or with FRCs or DLBCL-FRCs(p). TILs, DLBCL cells, and DLBCL-FRCs(p) were autologous (representative patient data from n = 2 independent patient samples, ABC and GCB-DLBCL). (E) OT-I T lymphocyte cytotoxicity against IμHABcl6 DLBCL cells loaded with SIINFEKL. OT-I exposed to FRCs pulsed with (+) or without (–) SIINFEKL before cytotoxicity assays. (F) Histograms of PD-L1 and PD-L2 expression on WT-FRCs (gray, n = 3) or IμHABcl6-FRCs (red, n = 5). (G) Schematic shows pretreatment of FRCs with anti–PD-L1/PD-L2 in the antigen-specific model. OT-I–mediated anti-DLBCL cytotoxicity. (B, C, E, and G) Representative data from n = 3 independent sample experiments. Data are represented as mean ± SEM (B-D, E, and G). *P < 0.05; **P < 0.01; ***P < 0.001; ****P < 0.0001, 1-way ANOVA with Tukey’s test (C–E, and G) or Mann-Whitney U test (B).

