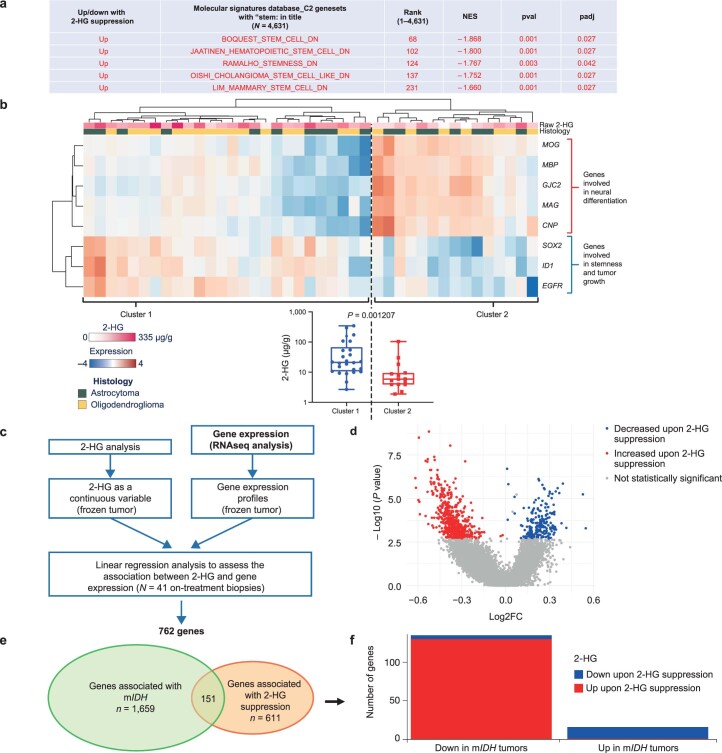
Extended Data Fig. 5. Gene expression analysis of frozen tissue samples.
a, Modulation of top stemness-related pathways associated with cellular differentiation in the central nervous system upon 2-HG suppression. ‘DN’ indicates that genes in these pathways are downregulated in stem cells. Padj is P value adjusted for multiple comparisons as described in the Methods: if padj<0.05, the pathway is significantly associated with 2-HG suppression. b, Unsupervised clustering of 2-HG–associated genes involved in neuronal differentiation and stemness (N = 41). Box plot: horizontal lines denote median values, boxes denote 25th to 75th percentiles, whiskers go from the smallest to the largest values; two-sided P value generated with Student’s t test. c, Methodology for the determination of genes associated with 2-HG suppression. d, Volcano plot highlighting genes associated with 2-HG suppression. e, Venn diagram between genes associated with IDH mutations derived by comparing wild-type IDH and mIDH low-grade glioma in The Cancer Genome Atlas dataset and genes associated with 2-HG suppression as shown in Extended Data Fig. 5a. f, Plot of the 151 overlapping genes derived from Panel a. Note that the majority of genes that are downregulated in mIDH tumors (left bar) are upregulated upon 2-HG suppression and vice versa (right bar). 2-HG denotes D-2-hydroxyglutarate; FC, fold change; IDH1, isocitrate dehydrogenase; mIDH1, mutant isocitrate dehydrogenase; NES, normalized enrichment score; padj, adjusted P value pval, P value; RNAseq, RNA sequencing.

