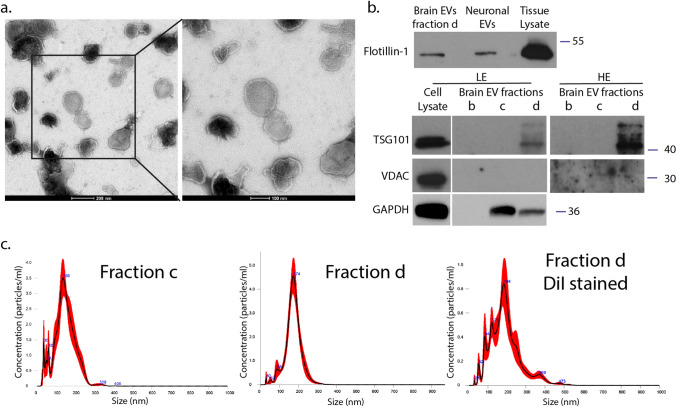
Fig. 1.
Characterization of mouse brain-derived EVs. α. Negatively stained TEM of EVs from fraction d. Scale bar 200 nm (left panel) and 100 nm (right panel). b. Western blotting of brain-derived EVs isolated from fraction d (lane 1), EVs derived from primary neuronal culture (lane 2), and brain tissue lysate (lane 3) (upper panel). 15 μg total protein loaded. Western blotting of different fractions (b, c, d) against TSG101, VDAC, and GAPDH. Cell lysate from HEK-293 cells was used as a positive control (LE: low exposure; HE: high exposure). 30 μg total protein loaded. f. Representative NTA distribution profile of EVs (fraction c and d, as well as DiI-stained fraction d), including size distribution plots and mean size of each peak

