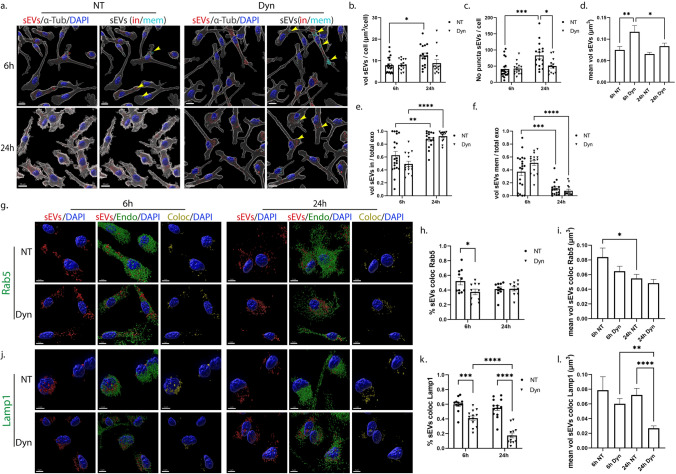
Fig. 5.
Uptake and endocytic trafficking of sEVs in primary microglia following inhibition of the dynamin-dependent endocytic pathway. Cells were incubated with Dil-labeled sEVs (red), in the absence (NT) or presence of Dynasore (Dyn) for 6 h and 24 h. Cells were fixed and immunostained against α-Tubulin (α-Tub) (gray) and DAPI (blue). Representative Imaris images depict the internalization of sEVs masked with the α-Tubulin surface and in/mem sEVs without (NT) or with Dynasore (Dyn) at 6 h and 24 h (a) of incubation with sEVs. Scale bar 10 μm. Graphs show the total volume of internalized sEVs per cell (b), the number of sEV puncta per cell (c), the mean volume of internalized sEVs (d), the percentage of sEV volume, inside (e) or on the membrane (f) per total volume of sEVs. The endocytic trafficking of sEVs was evaluated by measuring the colocalization of sEVs with Rab5 (g–i) and Lamp1 (j–l). ‘’sEVs mem’’ were depicted with arrowheads. Scale bar 5 μm. Graphs show colocalization between sEVs and Rab5 (h) or Lamp1 (k) and the mean volume of colocalized puncta (i and l, respectively) at different time points. Data are presented as the mean ± SEM of minimum three independent cell preparations, with at least two replicates per assay; one-way ANOVA with Tukey’s correction was used for (d), (i), and (l), two-way ANOVA with Tukey’s correction for (b), (e), (f), (h), and (k) and multiple t test for (c). Statistical significance was set as *p < 0.05, **p < 0.01, ***p < 0.001, ****p < 0.0001

