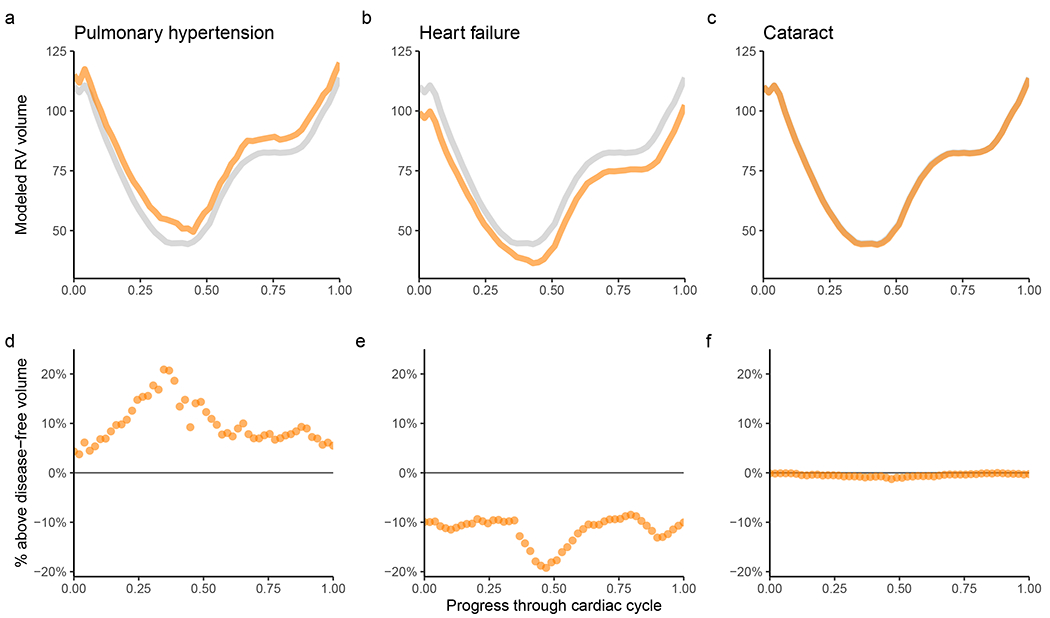
Figure 3 |. Alterations in right ventricular volume with prevalent disease.

Disease diagnoses that occur prior to the date of MRI are linked with distinct changes in the volume of the RV throughout the cardiac cycle. For all panels, the x-axis represents fractions of a cardiac cycle (divided evenly into 50 components, starting at end-diastole). a-c, The y-axis represents volume in mL. Values are generated with a linear model for each time point accounting for the left ventricular volume at that time point, as well as clinical covariates; the gray line represents the population without disease, while the orange line represents the population with disease. In the UK Biobank, participants with pulmonary hypertension (a) have elevated right ventricular volume throughout the cardiac cycle, even after accounting for left ventricular volume. Those with heart failure (b) predominantly have elevated left ventricular volume, with relative sparing of their right ventricular volume (see Supplementary Fig. 4 for right ventricular volume without adjustment for left ventricular volume). Cataract (c) is used as a control to demonstrate little association between a non-cardiovascular disease and the volume of the RV. d-f, For pulmonary hypertension (d), heart failure (e), and cataract (f), at each time point the right ventricular volume of individuals with disease is subtracted from the volume without disease and divided by the volume without disease. This represents the percentage above or below the disease-free right ventricular volume for those with disease.
