
Figure 4 |. Manhattan plots of right heart traits.
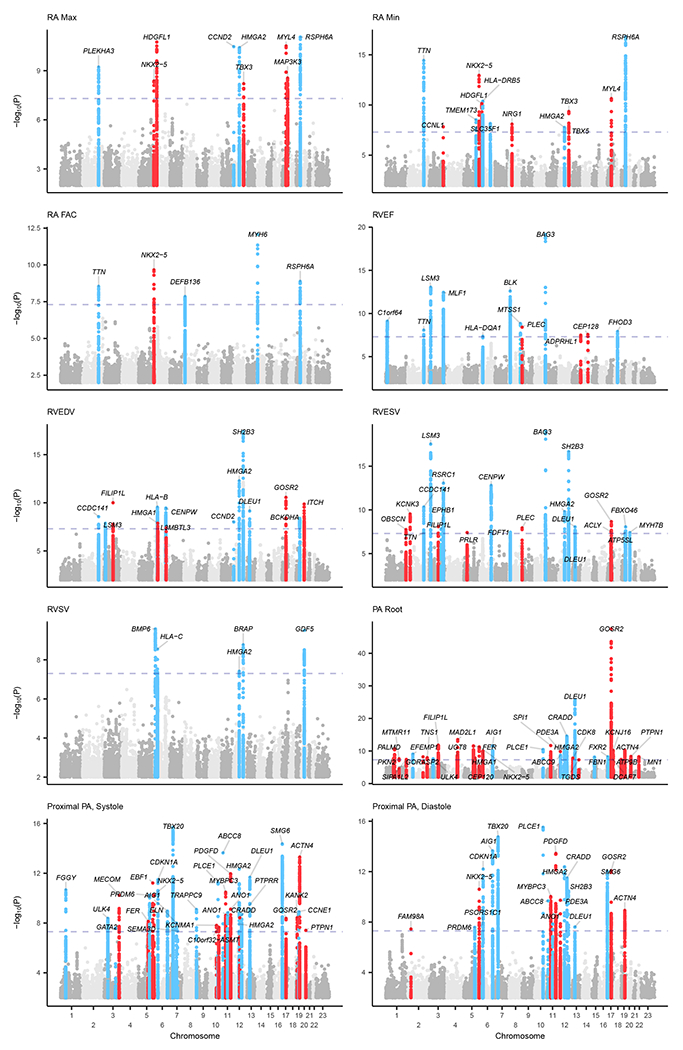
Manhattan plots show the chromosomal position (x-axis) and the strength of association (−log10 of the P-value, y-axis) for all non-BSA-indexed phenotypes. The X-chromosome is represented as “Chromosome 23.” Loci that contain SNPs with P < 5 × 10⁻⁸ were labeled with the name of the nearest gene; genes may appear multiple times for the same trait when multiple variants at the same locus are in linkage equilibrium with one another (r2 < 0.001). Loci were colored blue if they were also associated with left heart phenotypes with P < 5 × 10⁻⁸, and red otherwise. SNPs with P > 0.01 are not plotted. Manhattan plots by compartment are available in Supplementary Figure 7 (RA), Supplementary Figure 8 (RV), and Supplementary Figure 9 (pulmonary root and PA).