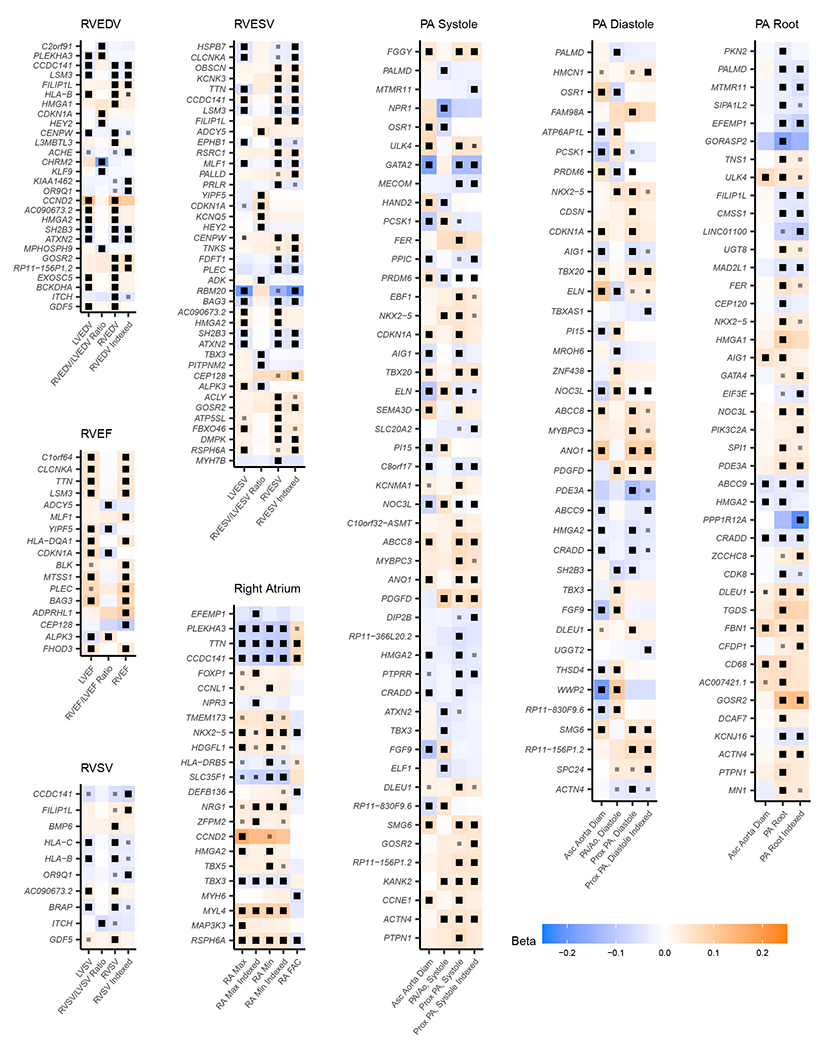
Figure 5 |. Right heart loci.

Right heart loci are shown grouped by trait. Where a paired left-heart phenotype is available, the effect size and P-value for the same SNP are shown next to its corresponding right heart trait. Each grid region represents the lead SNP (sorted in chromosomal order and tagged by its nearest gene, labeled on the y-axis) for each trait (x-axis). The effect magnitude (Beta) is represented with shades of orange (increase) and blue (decrease), and the effect direction is oriented with respect to the minor allele within the study population. Black boxes within a grid region indicate that the association between the SNP and the trait has BOLT-LMM P < 5 × 10⁻⁸; those with a smaller gray box indicate BOLT-LMM P < 5 × 10⁻⁶. Exact effect sizes and P values are provided in Supplementary Table 7 for traits with BOLT-LMM P < 5 × 10⁻⁸, and in the publicly available summary statistics where BOLT-LMM P ≥ 5 × 10⁻⁸. “PA/Ao” is the ratio of the PA diameter to the ascending aortic diameter. “Indexed” traits have been divided by body surface area. Genes may appear multiple times for the same trait when multiple variants at the same locus are in linkage equilibrium with one another (r2 < 0.001).
