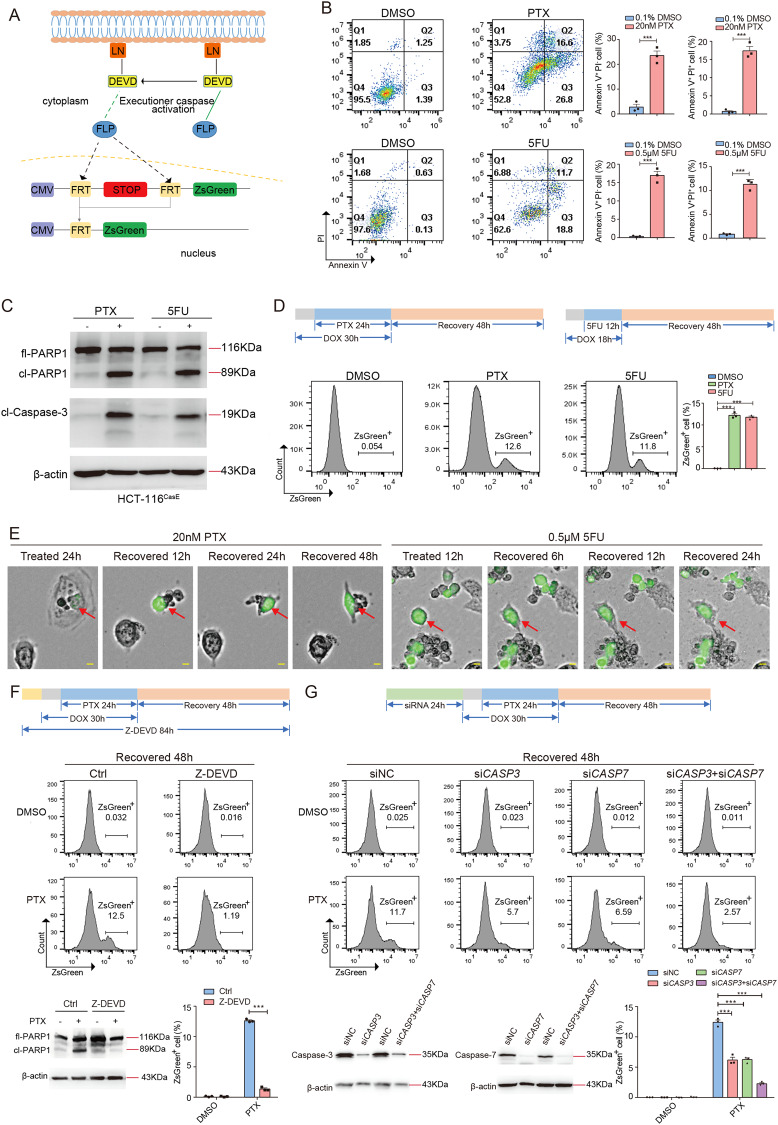
Fig. 1. Anastasis occurs in colorectal cancer cells after treatment with chemotherapeutic drugs.
A The schematic of mCasExpress sensor. LN: Lyn11-NES. B Annexin V - Propidium Iodide (PI) staining to detect apoptosis in HCT-116CasE cells after 24 h treatment with 20 nM PTX or 0.1% DMSO (upper row) and after 12 h treatment with 0.5 μM 5FU or 0.1% DMSO (lower row). N = 3. C Western blots of full-length PARP1 (fl-PARP1), cleaved PARP1 (cl-PARP1), and cleaved caspase-3 (cl-Caspase-3) in HCT-116CasE cells after 24 h treatment with 20 nM PTX or 0.1% DMSO (−), and after 12 h treatment with 0.5 μM 5FU or 0.1% DMSO (−). D Quantification of the percentage of ZsGreen+ cells in HCT-116CasE cells after 48 h recovery from PTX or 5FU treatment by flow cytometry. N = 3. E Representative images from time-lapse live imaging of HCT-116CasE cells during recovery after 24 h PTX treatment (left), and during recovery after 12 h 5FU treatment (right). The scale bars are 50 μm. The red arrows point to the examples of the cells undergoing anastasis. F Analysis of the effect of caspase inhibitor Z-DEVD-fmk (Z-DEVD) on the percentage of ZsGreen+ cells in HCT-116CasE cells at 48 h recovery after PTX treatment. N = 3. The western blots show the efficiency of inhibition of executioner caspase activity through cleavage of caspase substrate PARP1. G Analysis of the effect of knocking down CASP3 and/or CASP7 on the percentage of ZsGreen+ cells in HCT-116CasE cells at 48 h recovery after PTX treatment. N = 3. The western blots show the knockdown efficiency. In all bar graphs, error bars represent the standard error of the mean. *: P < 0.05. **: P < 0.01. ***: P < 0.001.

