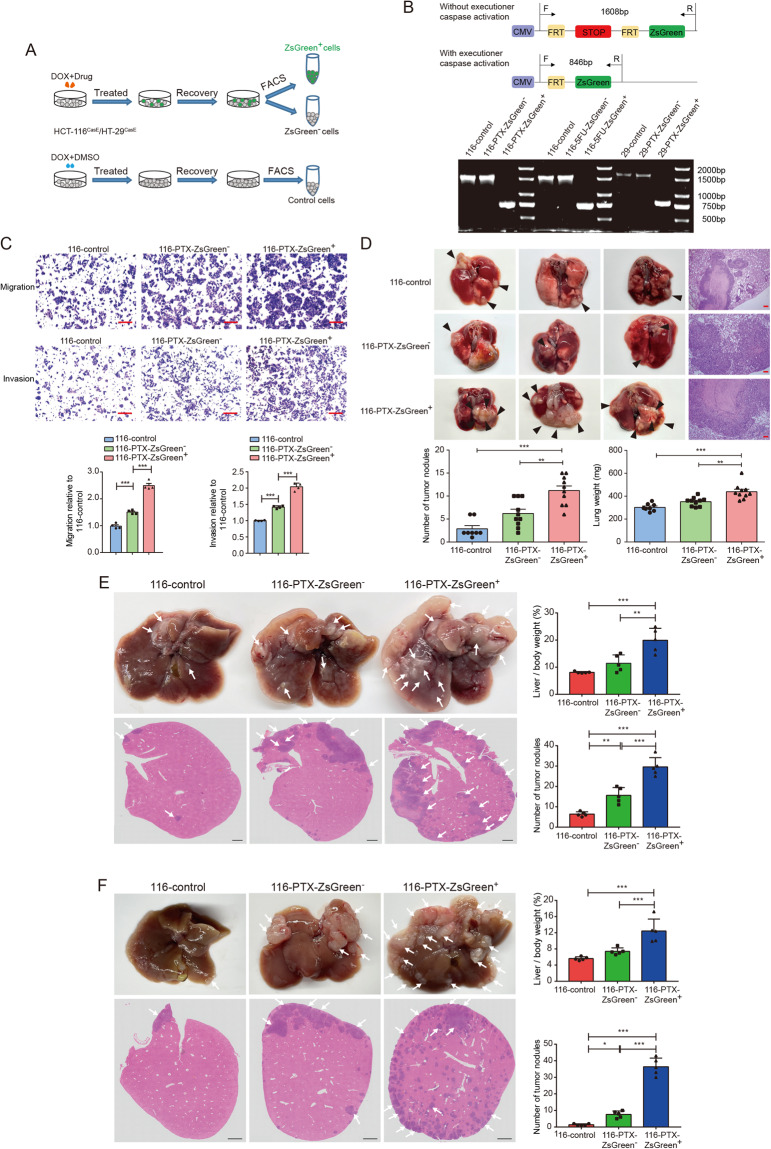
Fig. 2. Anastatic colorectal cancer cells acquire enhanced migration and metastasis.
A The workflow of isolating the ZsGreen−, the ZsGreen+, and the control populations. B Genotyping of different cell populations. The upper shows the position of primers and the size of PCR products. The lower is the result of genotyping. C Transwell assays to evaluate the migration and invasion capacity of 116-control, 116-PTX-ZsGreen− and 116-PTX-ZsGreen+ cells. Scale bars are 50 μm. N = 4. D Lung colonization of 116-control, 116-PTX-ZsGreen− and 116-PTX-ZsGreen+ cells. In the upper part are the images of representative lungs and Hematoxylin & Eosin (H&E) staining. Scale bars are 100 μm. The arrowheads point to examples of tumor nodules. In the lower row are the quantifications of the numbers of tumor nodules in lungs from each mice and the lung weights in mice injected with the indicated populations. N = 8 in 116 control group and N = 10 in 116-PTX-ZsGreen− group and 116-PTX-ZsGreen+ group. E Liver metastasis of the indicated populations after splenic injection. Arrows in images of livers and H&E staining point to examples of tumor nodules. Scale bars are 1 mm. N = 5. F Liver metastasis of orthotopic tumors. Arrows in images of livers and H&E staining point to examples of tumor nodules. Scale bars are 1 mm. N = 5. In all bar graphs, error bars represent the standard error of the mean. *P < 0.05, **P < 0.01, ***P < 0.001.

