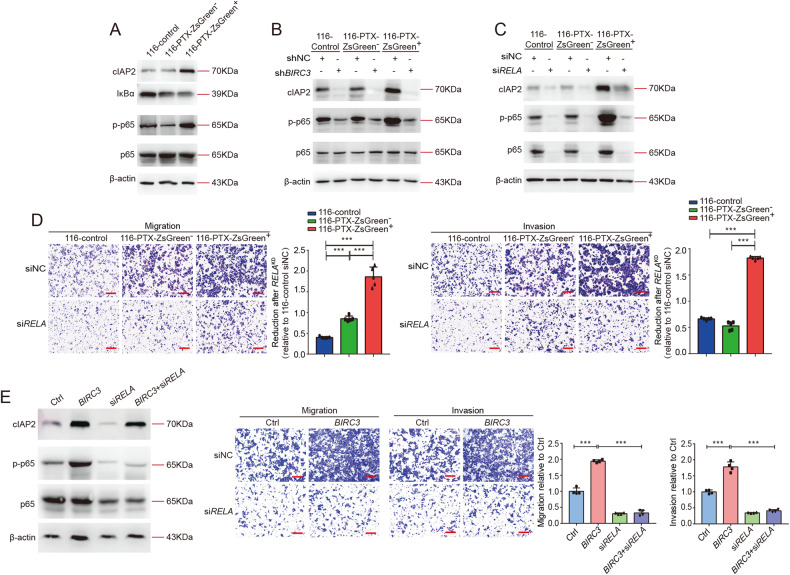
Fig. 4. cIAP2 activates NF-κB signaling to drive migration.
A Western blots showing the protein levels of cIAP2, IκBα, p-p65, and p65 in 116-control, 116-PTX-ZsGreen− and 116-PTX-ZsGreen+ cells. B, C Western blots showing the effect of BIRC3 knockdown (B) and RELA knockdown (C) on the protein levels of cIAP2, p-p65, and p65 in the indicated cells. D The effect of knocking down RELA on cell migration and invasion. Scale bars are 50 μm. The bar graphs show reduction after knocking down RELA (RELAKD). Data were normalized to 116-control siNC. N = 5. E The effect of knocking down RELA on migration and invasion of the BIRC3-overexpressing HCT-116 cells. On the Left are Western blots showing the protein levels of cIAP2, p-p65, and p65. Scale bars are 50 μm. N = 4. In all bar graphs, error bars represent the standard error of the mean. *P < 0.05. **P < 0.01. ***P < 0.001.

