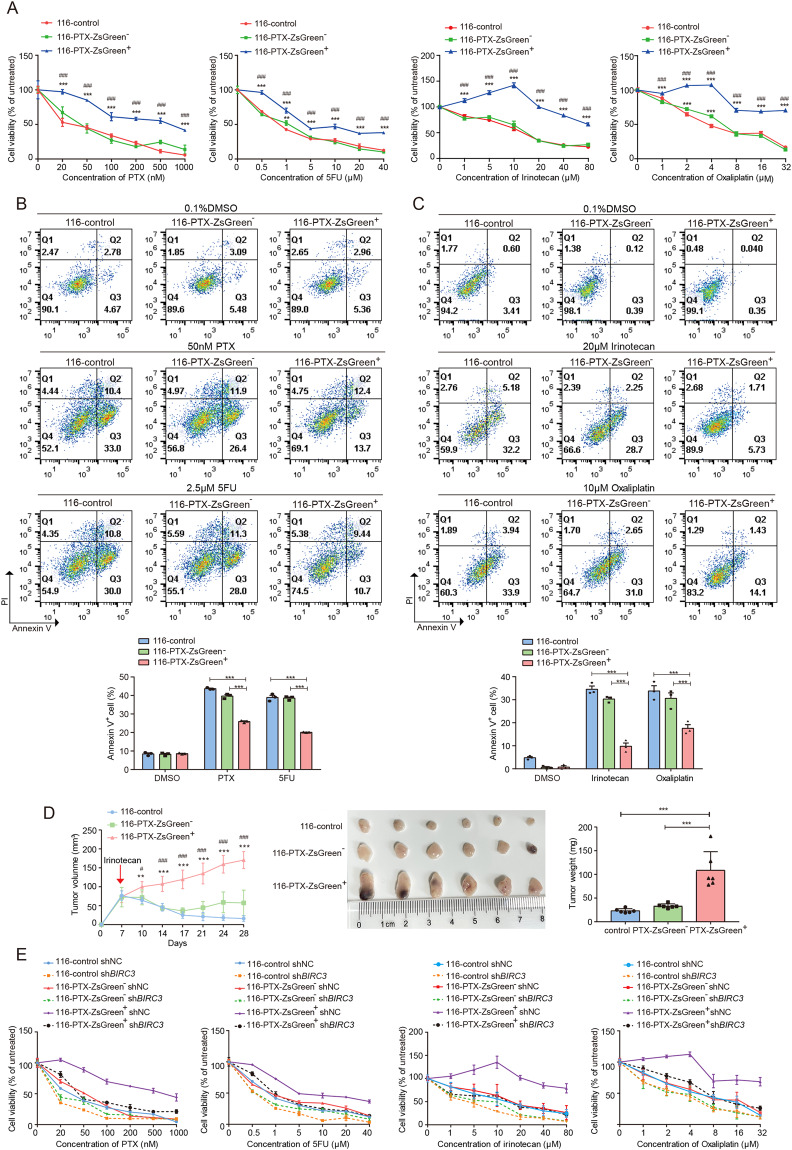
Fig. 5. Anastatic cells acquire enhanced drug resistance through upregulated BIRC3.
A The results of MTT assays showing the viability of 116-control, 116-PTX-ZsGreen− and 116-PTX-ZsGreen+ cells after 48 h treatment with different concentrations of PTX, 5FU, irinotecan or oxaliplatin. N = 6. B Annexin V-PI staining to detect apoptosis in 116-control, 116-PTX-ZsGreen− and 116-PTX-ZsGreen+ cells after 48 h treatment with 0.1% DMSO, 50 nM PTX or 2.5 μM 5FU. N = 3. C Annexin V-PI staining to detect apoptosis in 116-control, 116-PTX-ZsGreen− and 116-PTX-ZsGreen+ cells after 48 h treatment with 0.1% DMSO, 20 μM irinotecan or 10 μM oxaliplatin. N = 3. D Growth of tumors formed by 116-control, 116-PTX-ZsGreen− and 116-PTX-ZsGreen+ cells in nude mice with irinotecan treatment. On the left are the growth curves of tumors formed by the indicated cell populations. N = 6. The red arrow shows the time of first irinotecan injection. In the middle is the image of tumors collected after six times of irinotecan injection. On the right is the summary of tumor weights. N = 6. E The effect of BIRC3 knockdown on cell viability upon PTX, 5FU, irinotecan, or oxaliplatin treatment. N = 6. Error bars represent the standard error of the mean. * or #P < 0.05. ** or ##P < 0.01. *** or ###P < 0.001. A, D * represents significant difference compared to 116-control and # represents a significant difference compared to the ZsGreen− group.

