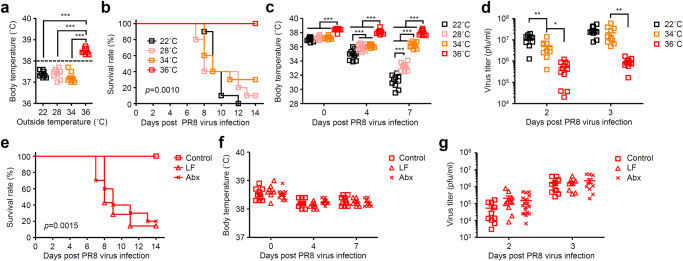
Fig. 2. High body temperature increases gut microbiota-dependent host resistance to influenza virus infection.
Mice were kept at 22, 28, 34, or 36 °C for 7 days before influenza virus infection and throughout infection. a Body temperature of naïve mice kept at 22, 28, 34, or 36 °C were measured (22 °C, n = 8 mice; 28 °C, n = 8 mice; 34 °C, n = 9 mice; 36 °C, n = 8 mice). The dashed line indicates 38 °C. b–d Mice kept at 22, 28, 34, or 36 °C were infected intranasally with 1000 pfu of influenza virus. Mortality (b; 22 °C, n = 10 mice; 28 °C, n = 10 mice; 34 °C, n = 10 mice; 36 °C, n = 10 mice), body temperatures (c; 22 °C, n = 10 mice; 28 °C, n = 10 mice; 34 °C, n = 10 mice; 36 °C, n = 10 mice), and virus titer in the lung wash (d; 22 °C, n = 10 mice; 34 °C, n = 10 mice; 36 °C, n = 11–12 mice) were measured on indicated days after challenge. e–g Low fiber (LF)-fed, antibiotics (Abx)-treated, and control mice kept at 36 °C were infected intranasally with 1000 pfu of influenza virus. Mortality (e; control, n = 10 mice; LF-fed, n = 7 mice; Abx-treated, n = 10 mice), body temperatures (f; control, n = 10 mice; LF-fed, n = 7 mice; Abx-treated, n = 10 mice), and virus titer in the lung wash (g; control, n = 10 mice; LF-fed, n = 8–11 mice; Abx-treated, n = 10–18 mice) were measured on indicated days after challenge. Each symbols indicate individual values (a, c, d, f, g). Data are mean ± s.e.m. Data are representative of two independent experiments (a–f) or are pooled from two independent experiments (g). Statistical significance was analyzed by two-way analysis of variance (ANOVA) (a, c, d, f, g) or two-sided log-rank (Mantel-Cox) test (b, e). *P < 0.05, **P < 0.01, ***P < 0.001.

