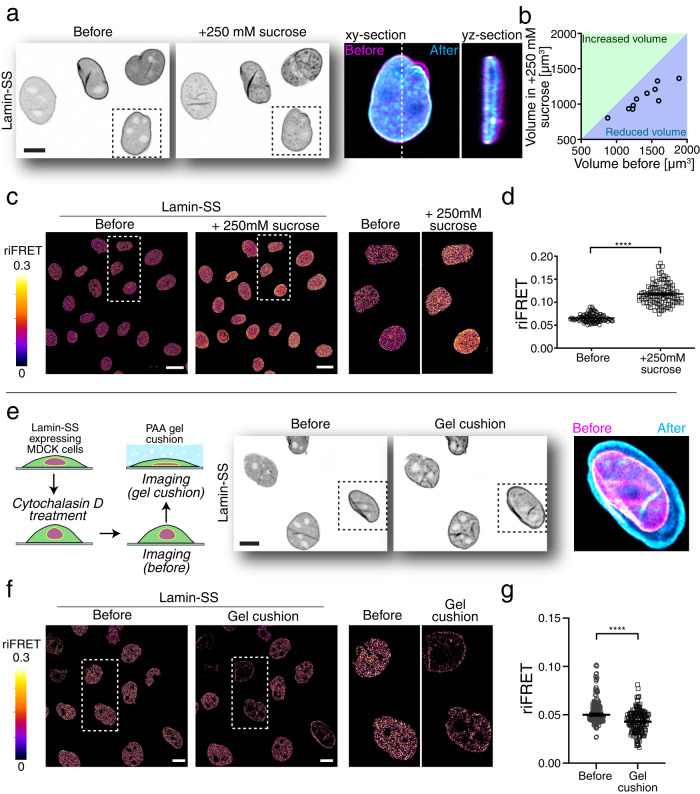
Fig. 2. The effect of nuclear deformation on lamin A/C strain state.
a Representative image of Lamin-SS expressing cells (left) subjected to hyper-osmotic conditions by adding medium containing 250 mM sucrose for 15 min before the imaging (middle). Single cell blow-up indicated the change in nuclear morphology before (magenta) and after (cyan) the osmotic shock (right). Scale bar 10 µm. b Scatterplot of quantified nuclei volumes indicating clear reduction of the nuclear volume. c riFRET efficiency images of osmotically stressed Lamin-SS expressing cells and blow-up images. Scale bars, 20 µm. d Quantified Lamin-SS riFRET (mean ± SEM; n = 304 cells, three biological replicates). Two-tailed Wilcoxon matched-pairs test (****p < 0.0001). Scale bar 20 µm. e Hydrogel cushion was used to impose compressive stress to Lamin-SS expressing cells. Schematic representation of the experimental workflow (left). Representative confocal images of the Lamin-SS expressing cells before (magenta) and under the gel cushion (cyan) (middle) and the subsequent change in the nuclear morphology (right). Scale bar 10 µm. f riFRET efficiency images of Lamin-SS expressing cells before and under the gel cushion together with representative blow-up images. Scale bars, 10 µm. g Quantified riFRET (mean ± SEM) in Lamin-SS expressing cells subjected to compressive stress (n = 164 cells, two biological replicates). Two-tailed Wilcoxon matched-pairs test (****p < 0.0001).

