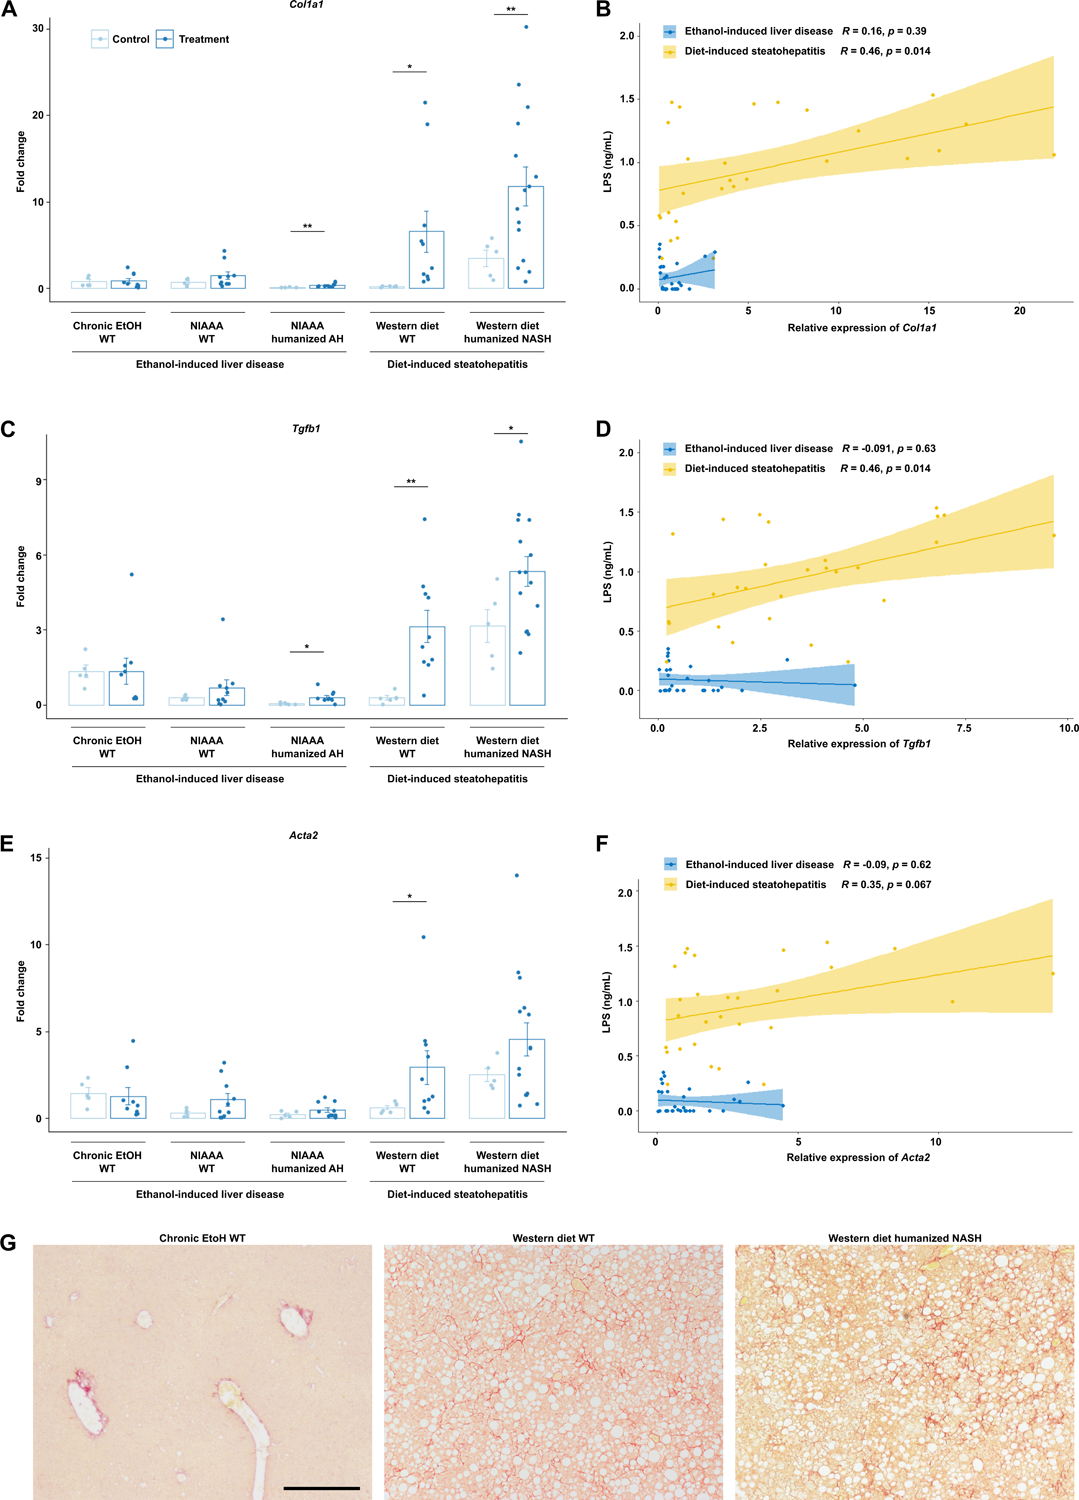
Figure 4. Diet-induced steatohepatitis is associated with more liver fibrosis.

Hepatic levels of (a) Col1a1, (c) Tgfb, and (e) Acta2 mRNAs in the five models of liver disease. Pearson’s correlation of (b) Col1a1, (d) Tgfb, and (f) Acta2 mRNAs and serum LPS concentrations in mice from all groups, stratified by ethanol versus diet-induced liver injury. (g) Representative Sirius red-stained liver sections. P values between mice in the control versus treatment groups were determined by two-sided Student t-test. *P < 0.05, **P < 0.01, ***P < 0.001. Scale bar indicates 200 um.
