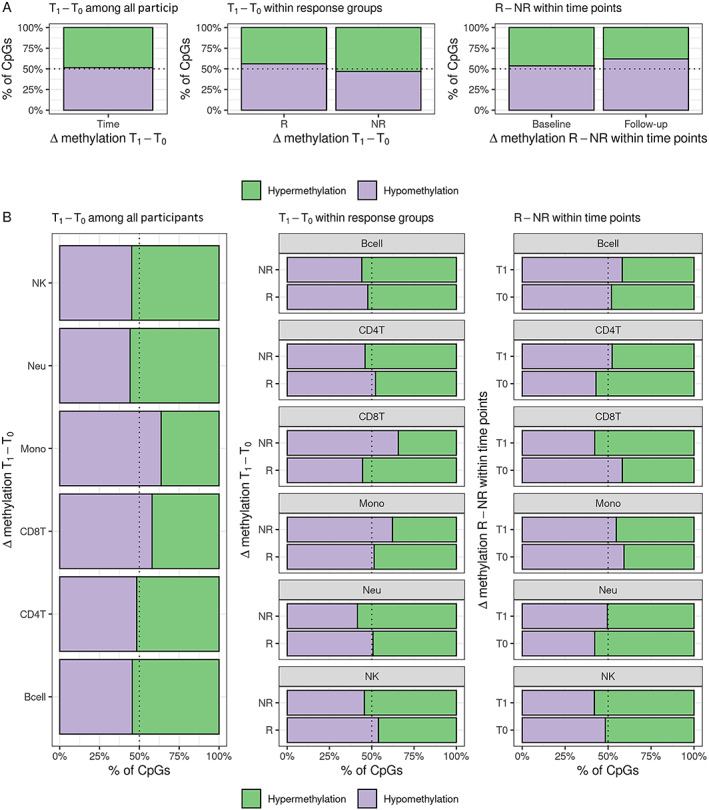
Figure 2.

Distribution of direction of estimated differential DNA methylation. (A) Whole blood Limma models and (B) cell‐specific TCA models. R = treatment response; NR = treatment nonresponse; T0 = DNA methylation at baseline visit; T1 = DNA methylation at follow‐up visit; NK = natural killer; Neu = neutrophil; Mono = monocyte; CD8T = CD8+ T cell; CD4T = CD4+ T cell; Bcell = B cell.
