
Figure 1. SA- β-gal activity and p16 in chondrocytes were associated with knee OA severity.
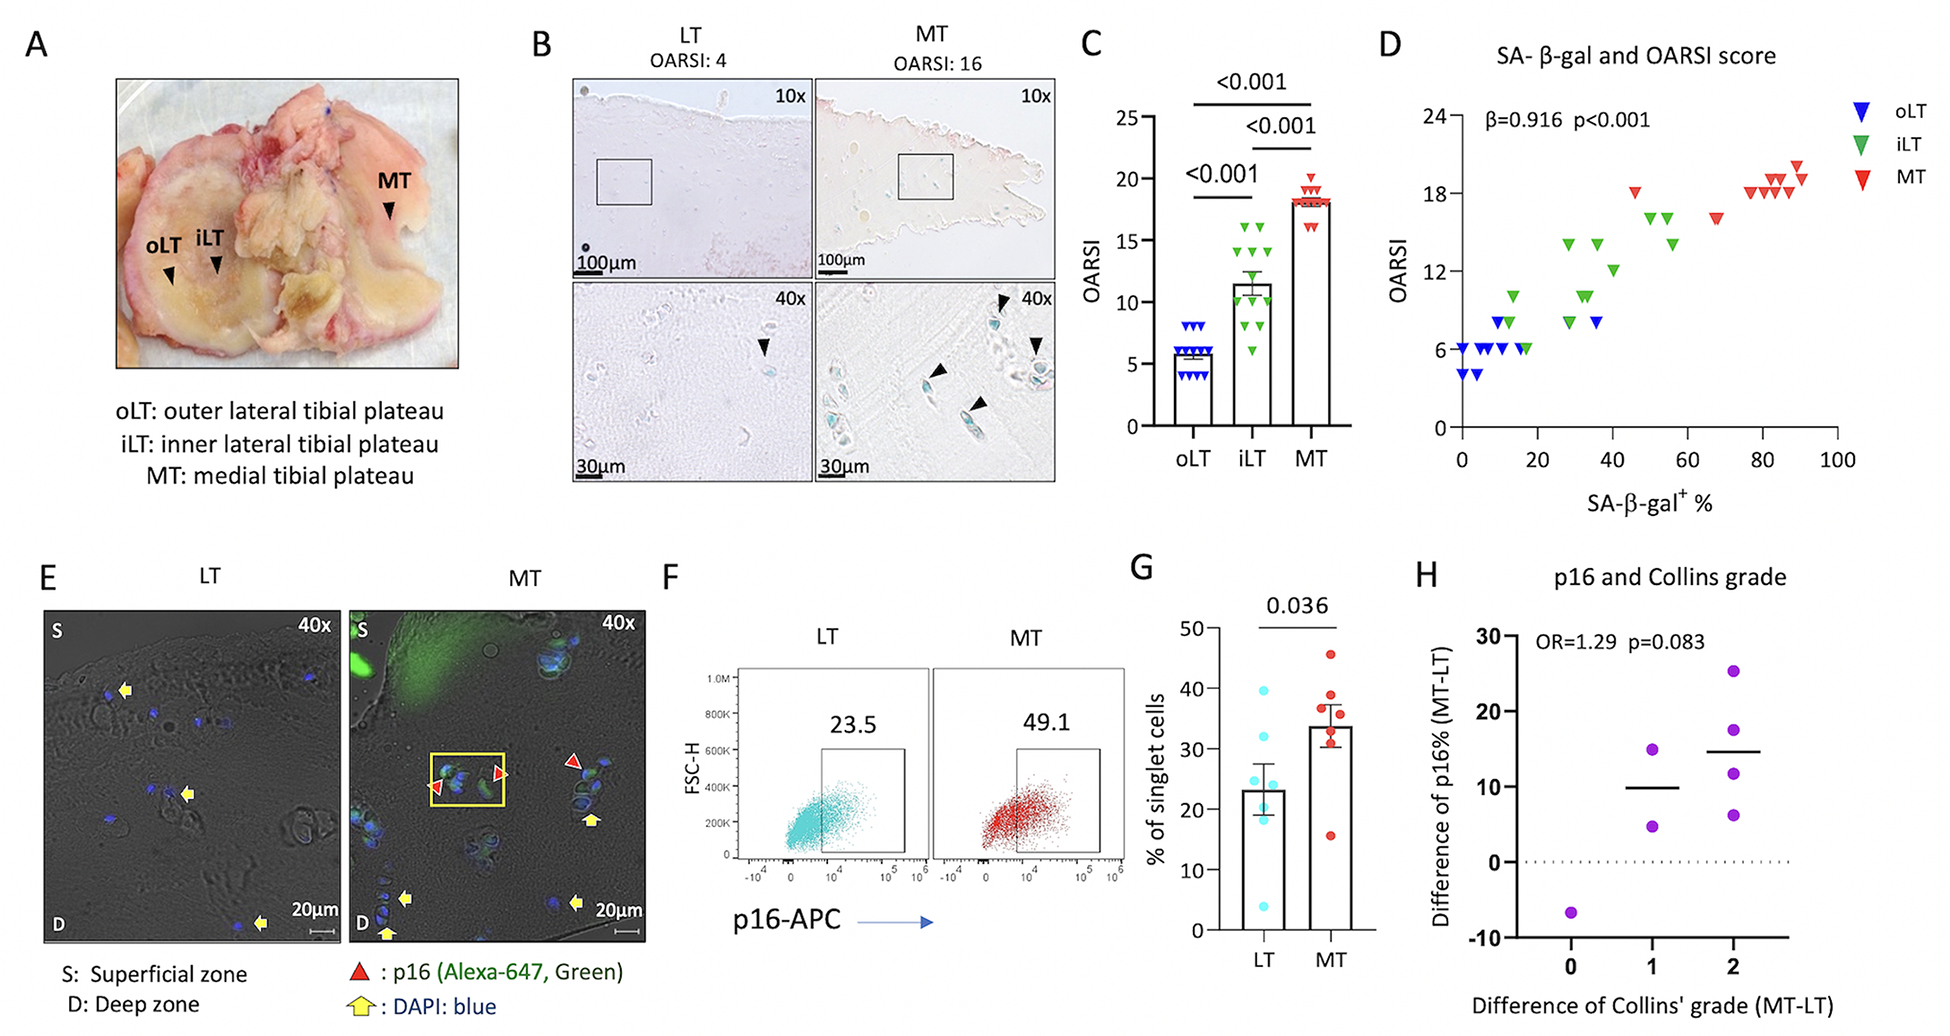
Data from 12 patients with medial compartment dominant OA. A) Human tibial plateau demonstrating the gradient of OA severity within an individual: MT>iLT>oLT severity of OA. B) Representative microscopic image demonstrating higher OARSI score of OA severity and SA-β-gal activity in MT than LT. C) OARSI score demonstrating MT>iLT>oLT OA severity (repeated measures ANOVA, n=12). D) Significant positive correlation of OARSI histological scores vs % SA-β-gal+ chondrocyte data scores (n=12). Shown are the correlation of raw values, however, for purposes of statistical analysis, these scores were transformed using a rank-based inverse normal transformation for use in mixed models yielding a significant correlation (β=0.916, p<0.001). p16 expression was qualitatively greater in MT than LT (representative immunofluorescence image in E); the percentage of p16+ chondrocytes by flow cytometry was greater in chondrocytes isolated from MT than LT (F, G, n=7). H) Dot plot demonstrating the correlation of difference in percentage of p16+ chondrocytes (MT-LT) and difference in Collins’ grade (MT-LT) (n=7).