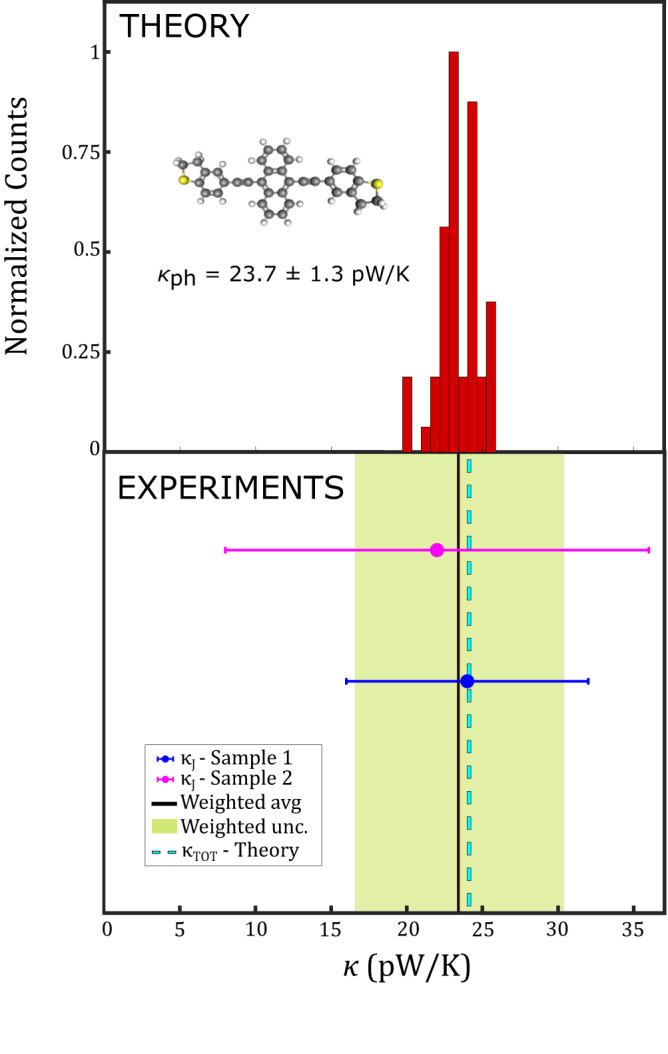
Fig. 3. Histogram of the theoretical phononic contribution κph to the total thermal conductance of the junction (top) vs. experimental total thermal conductance κJ (bottom).

In the top panel, the results obtained from MD simulations for the phononic thermal conductance of the DHBT-OPE3-An molecule are represented in the form of a histogram. The structure of the DHBT-OPE3-An molecule is also shown (carbon atoms in gray, hydrogen atoms in white, sulfur atoms in yellow). In the bottom panel, the black solid line is the weighted average (avg) between the two experiments, represented here by the two circles (sample 1, sample 2), each with their own uncertainty. The green shaded area, instead, represents the uncertainty (unc.) on the weighted average. For comparison with the experimental values, the cyan dashed line represents the total predicted thermal conductance obtained as a sum of the theoretical phonon conductance (i.e., the average of the theoretical histogram on top) plus the theoretical electronic contribution predicted by means of density functional theory.
