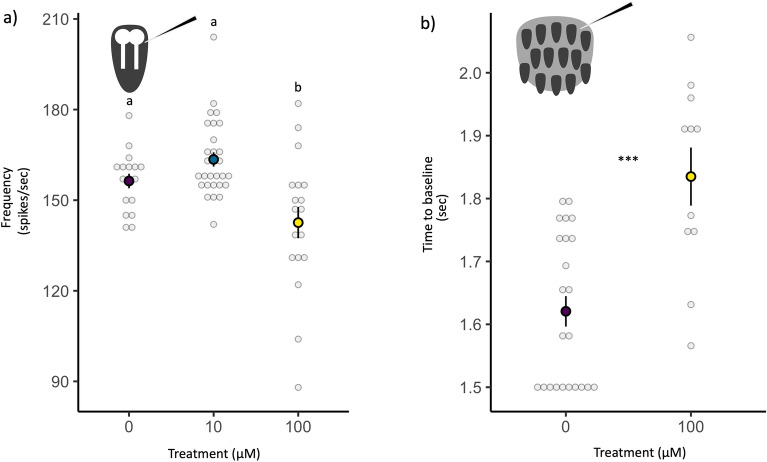
Figure 2.
The olfactory sensory neuron (OSN) response to an odor among flies maintained on three concentrations of imidacloprid. (a) The mean spikes per second by treatment are noted with bolded dots, ± standard error with the raw recording spike frequency in gray circles. Letters denote statistically distinct groups as identified by a Tukey post-hoc comparison. The top left corner of the figure includes a diagram of how electrophysiology responses were recorded from a sensillum, with OSN shown in white. (b) Time of electroantennogram to return to baseline activity after odor stimulation, grouped by treatment. The mean is shown with a bold dot with ± standard error, and each recording’s time to return to baseline is shown in gray circles. Asterisks denote statistically significant differences by treatment (***P < 0.001). The top left corner of the figure includes a diagram of how electroantennogram responses were recorded from the whole antenna, with the sensillum shown in dark gray.

