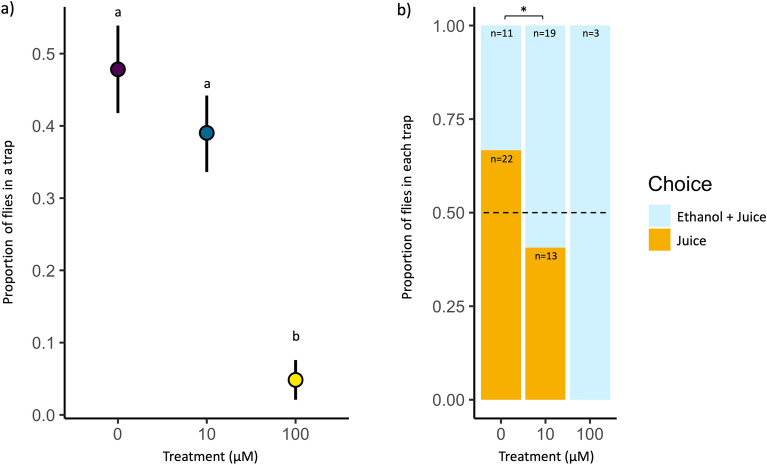
Figure 3.
(a) The proportion of flies (out of all tested) found in either trap by treatment. The mean is plotted in color as a bold dot with ± standard error. Letters denote statistically distinct groups as identified by a Tukey post-hoc comparison. (b) The proportion of flies (out of all “trapped” flies) in either of the two traps by treatment. Flies either chose the trap containing pineapple juice adulterated with 10% ethanol (Ethanol + Juice) or pure pineapple juice (Juice). Asterisks denote statistically significant differences by treatment (*P < 0.05).

