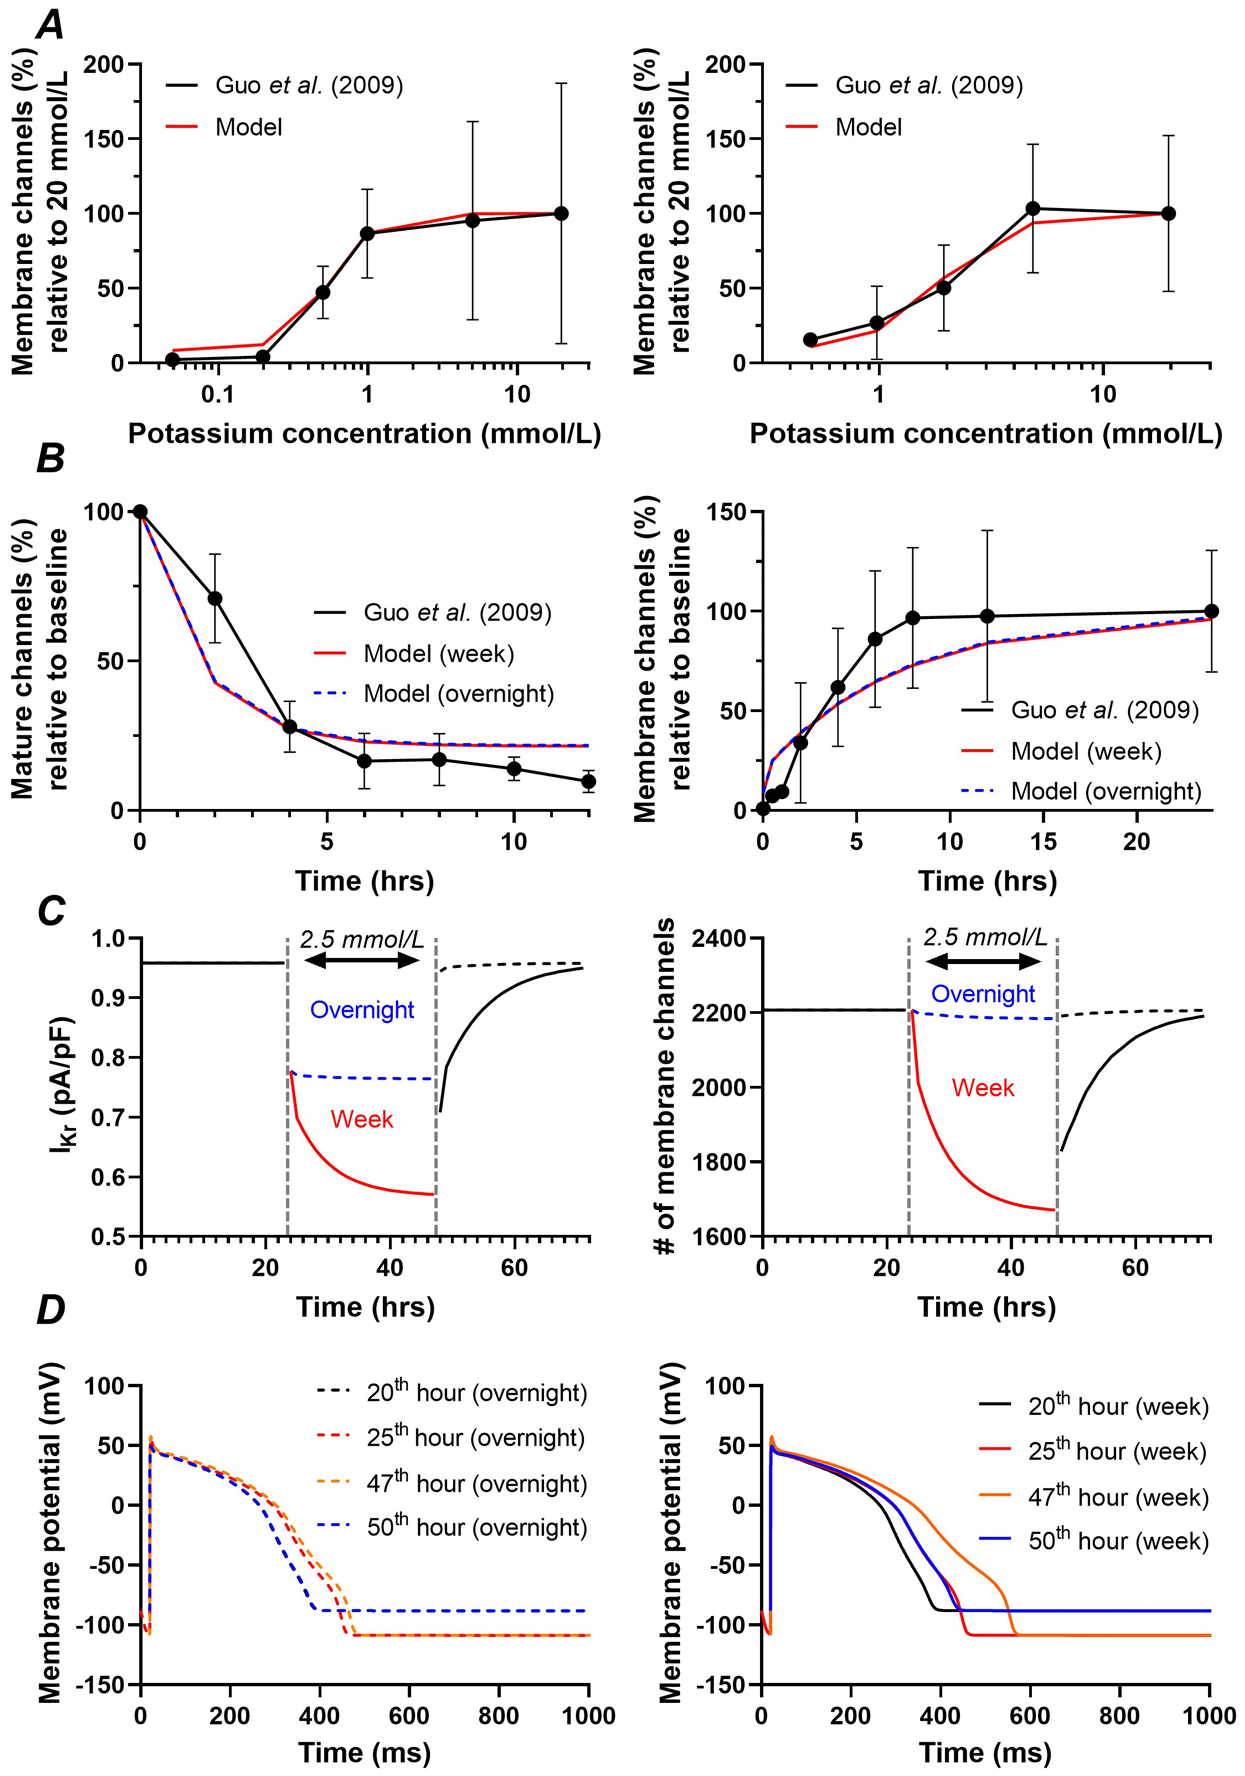
Figure 9. Modelling the effects of hypokalaemia.

A, Concentration-dependence of extracellular [K+] on Kv11.1 membrane levels based on overnight incubation (i.e., 12 hours; left) or incubation for one week (right) in experimental data (Guo et al., 2009) (black line/symbols) and corresponding model versions (red lines). Experimental data were based on IKr recordings in 5 mmol/L [K+] after incubation at the indicated concentration for 12 hours or one week, which were used as a proxy for Kv11.1 membrane levels. B, Time course of reduction in Kv11.1 membrane levels in response to incubation in low (0 mmol/L in experiments, 0.1 mmol/L in model) extracellular [K+] (left) or recovery after 12 hours at low extracellular [K+] following re-exposure to 5 mmol/L extracellular [K+] (right) in experimental data (Guo et al., 2009) as well as ‘overnight’ and ‘week’ model configurations. C, Simulated time course of IKr (left) and Kv11.1 membrane levels (right) during 24 hours at baseline (i.e., 5.4 mmol/L [K+]), followed by 24 hours with hypokalaemia (2.5 mmol/L), and 24 hours at baseline, revealing acute inhibition for both the ‘overnight’ and ‘week’ model configurations, and long-term decrease of Kv11.1 membrane levels for the ‘week’ parameters. The dashed vertical lines (grey) indicate the start and end of hypokalaemia. D, Action-potential morphology at various time points from the simulations in panel C for the ‘overnight’ parameters (dashed lines) and ‘week’ parameters (solid lines), showing the acute prolongation of repolarization duration for both parameter sets and subsequent additional APD prolongation for the ‘week’ parameters, which remains present after cessation of hypokalaemia due to the decrease in Kv11.1 membrane levels (compare blue vs. black curves in right panel).
