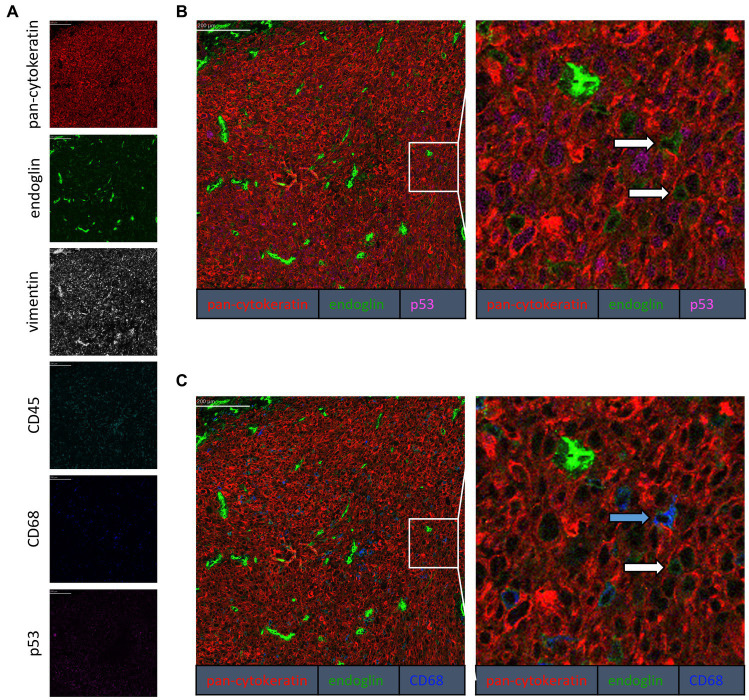
Figure 4.
Analysis of VSCC via imaging mass spectrometry (Hyperion) with a six marker panel. (A) Six images, each depicting the expression of the corresponding marker. (B) A merged image combining pan-cytokeratin, endoglin, and p53 expression. The white arrows indicate cells that co-express pan-cytokeratin and endoglin. (C) A merged image combining pan-cytokeratin, endoglin, and CD68 expression. The white arrow indicates cells that co-express pan-cytokeratin and endoglin, which are negative for CD68. The blue arrow indicates cells that co-express pan-cytokeratin, endoglin, and CD68.

