Figure 5.
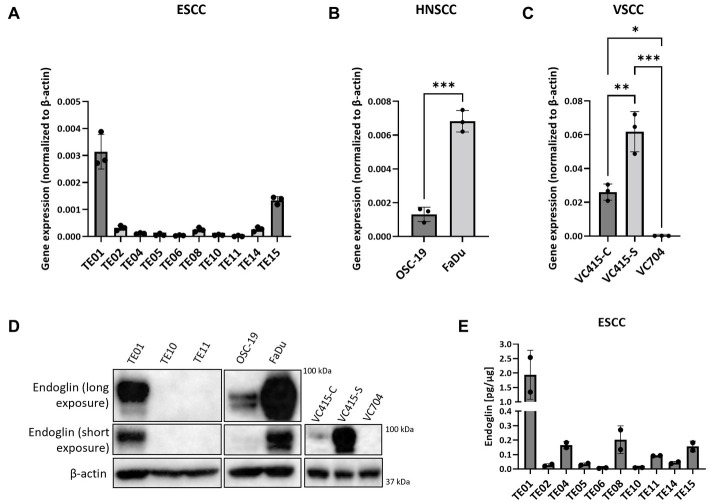
The expression of endoglin by SCC cell lines. Expression by 10 ESCC cell lines, where endoglin expression by TE01 ( p < 0.0001) and TE15 (p < 0.003) significantly differ from all other cell lines (A), OSC-19 and FaDu show significantly different endoglin expression (p = 0.0002) (B), as is also detected in the three VSCC cell lines (*p = 0.0123, **p = 0.0025, ***p = 0.0001) with different morphologies (conventional—VC415-C and VC704; spindle—VC415-S) (C). Endoglin protein levels were determined via western blot (D) and ELISA. Endoglin protein expression by TE01 significantly differs from all other cell lines—(p ≤ 0.0018) (E). Image for western blot analysis is a representative image of n = 2–3 independent experiments.

