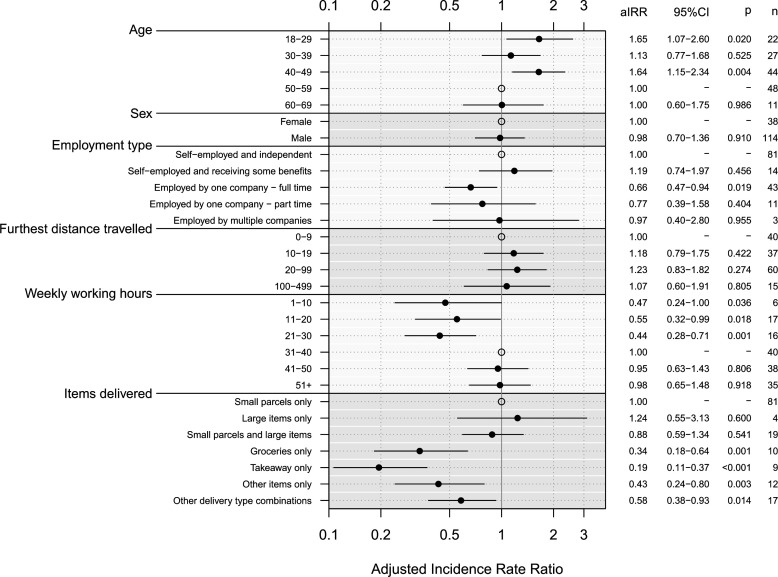
Figure 2.
Adjusted incidence rate ratios (aIRR) for mean number of customer contacts reported for selected variables. Explanatory variables included in the model: age, sex, employment type, furthest distance travelled from the collection point to a delivery, weekly working hours and the type of items delivered. Open circles represent the reference group for each variable.

