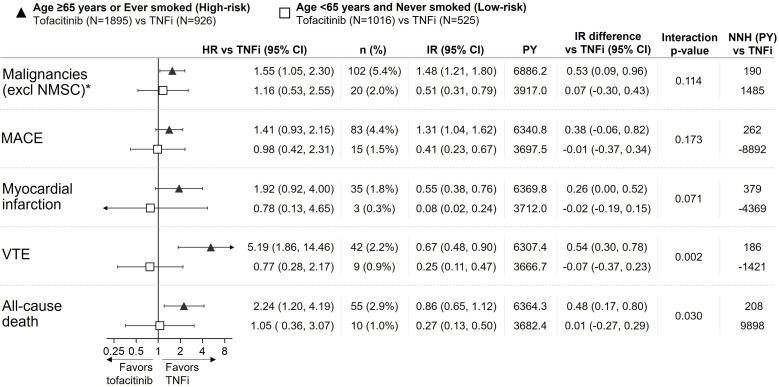
Figure 2.
Risk of malignancies (excluding NMSC), MACE, MI, VTE and all-cause death with tofacitinib versus TNFi in ORAL Surveillance by subgroups of high-risk and low-risk patients. HRs (95% CIs), shown on a logarithmic scale, are based on a simple Cox proportional hazard model comparing combined tofacitinib doses versus TNFi. Arrow heads indicate that CI extends beyond the graph axis. IRs express the number of patients with first events per 100 PY. Treatment-by-risk interaction p values were calculated based on IR differences (two-sided, normal approximation of difference in IR). NNH (PY) should be interpreted as the number of patient-years of exposure to tofacitinib required to have one additional event versus TNFi. All data are for combined tofacitinib doses. *Results reported in Curtis et al.7 IR, incidence rate; MACE, major adverse cardiovascular events; N, number of evaluable patients; n, number of patients with events; NMSC, non-melanoma skin cancer; NNH, numbers needed to harm; PY, patient-years; TNFi, tumour necrosis factor inhibitor; VTE, venous thromboembolism.

