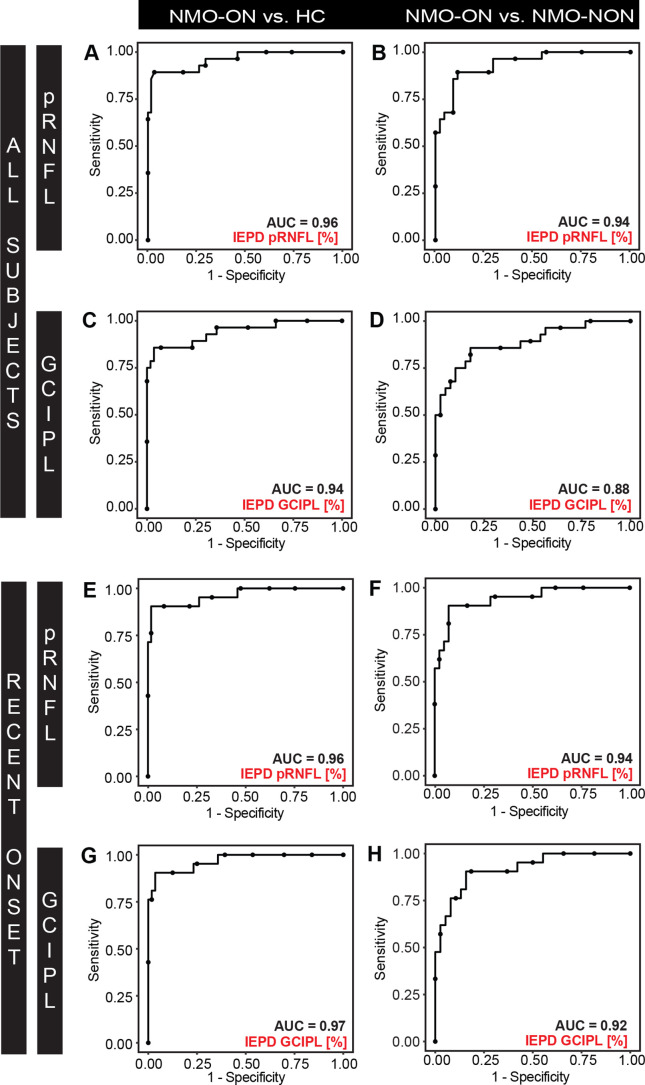
Figure 3.
ROC curves for IEPD for (A-B, E-F) pRNFL and (C-D, G-H) GCIPL discriminating between (A, C, E, G) NMOSD-ON versus HC, and (B, D, F, H) NMOSD-ON versus NMOSD-NON. ROC curves are plotted for (A-D) all subjects and (E-H) NMOSD-ON and NMOSD-NON patients with a disease duration <10 years and HC. AUC, area under the curve; GCIPL, combined ganglion cell and inner plexiform layer; HC, healthy controls; IEPD, intereye percentage difference, NMOSD-ON, patients with aquaporin-4-antibody seropositive neuromyelitis optica spectrum disorders and a history of unilateral optic neuritis; NMOSD-NON, patients with aquaporin-4-antibody seropositive neuromyelitis optica spectrum disorders and no history of optic neuritis; pRNFL, peripapillary retina nerve fibre layer; ROC, receiver operating characteristics.

