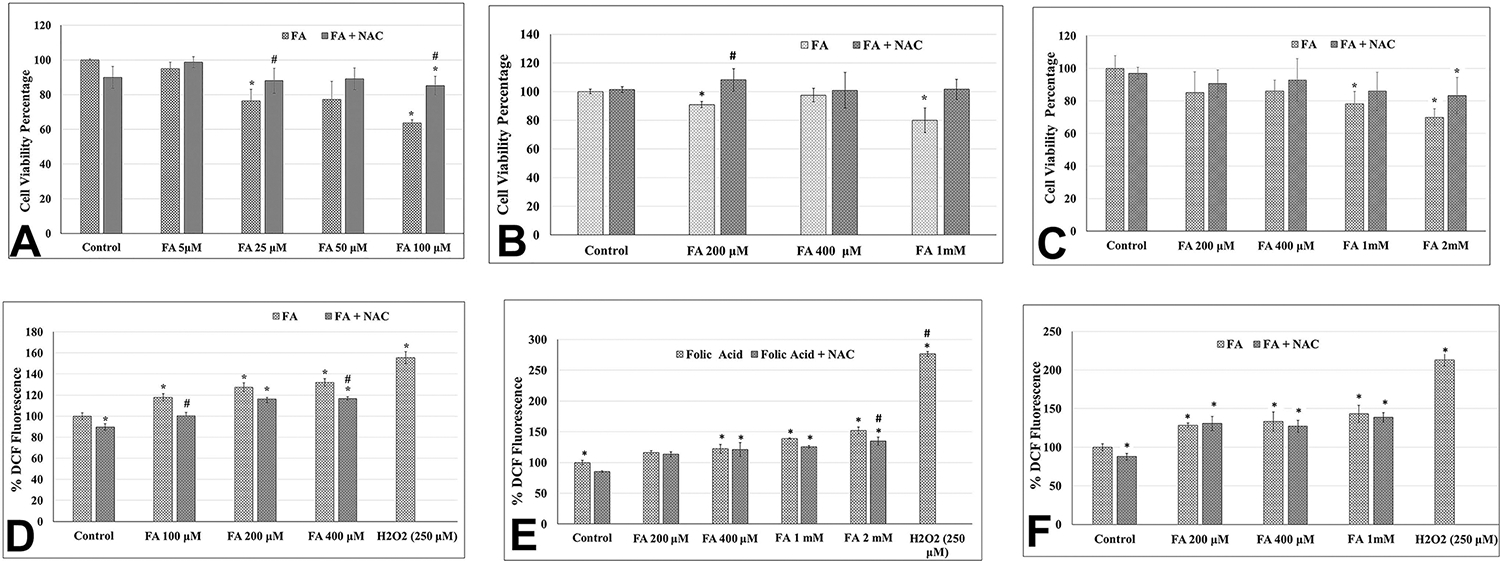
Figure 1.

Effect of acute exposure to folic acid (FA) on the growth of kidney epithelial cells as measured by the MTT assay (upper panel: A–C) and on the level of intracellular ROS as measured by the DCF assay (lower panel: D–F). Upper panel: Bar graph representing the cell viability (in percentage) in FA-treated Caki-1 cells (A), HK-2 cells (B), and NRK cells (C) as compared to their respective untreated control cells (as 100%). Lower panel: Bar graph representing DCF fluorescence (in percentage) in FA-treated Caki-1 cells (D), HK-2 cells (E), and NRK cells (F) as compared to their respective untreated control cells (as 100%). Different concentrations (as given in the graph) of FA either alone or in combination with 25 μM NAC were used for cotreatment. Error bar showing the standard deviation (±SD) of the mean of triplicate values. Statistically significant (P < 0.05) changes as compared to control are shown by the symbol “*”. A statistically significant change in the FA and NAC cotreated group as compared to FA alone is shown by the symbol “#”.
