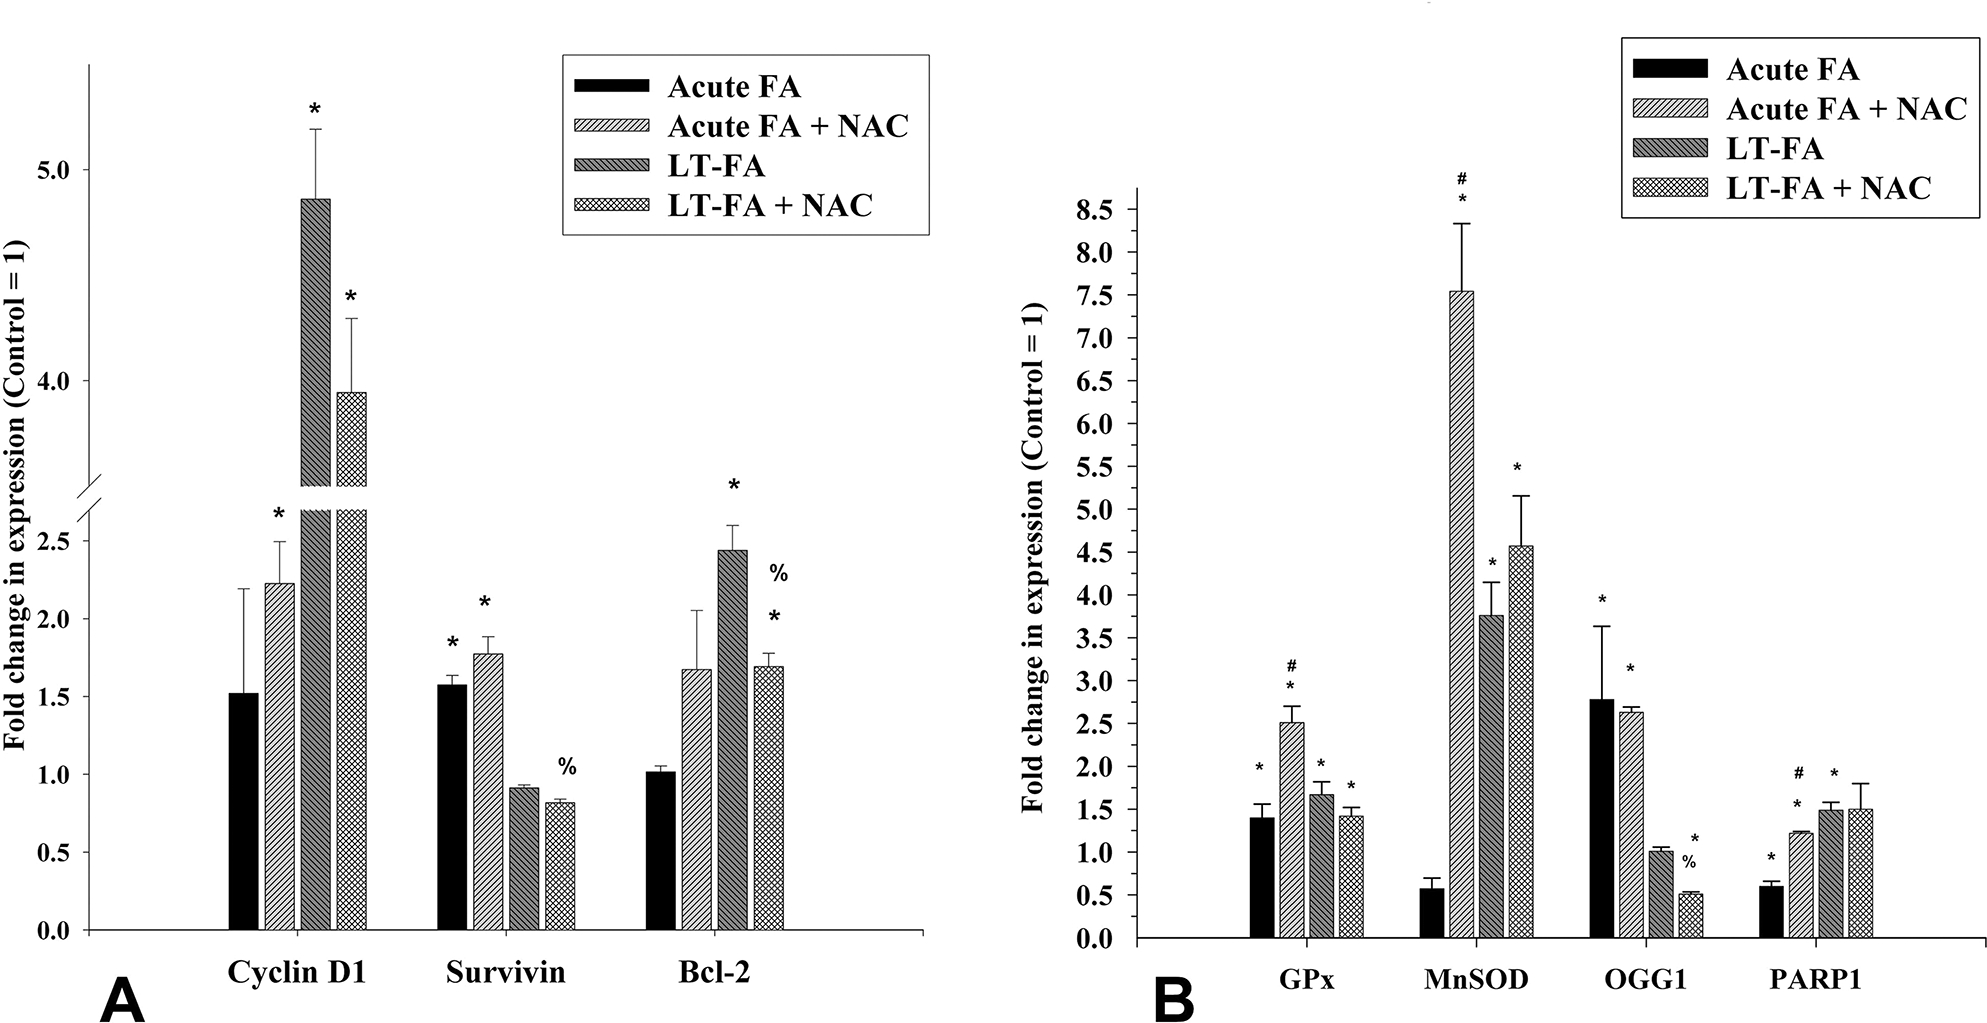
Figure 3.

Effect of acute and long-term exposure to folic acid (FA) on the expression of marker genes for cell proliferation/survival (cyclin D1, survivin, and Bcl-2), antioxidant (GPx1 and MnSOD), and DNA damage (OGG1 and PARP1) in Caki-1 cells as measured by quantitative real-time PCR. Bar graphs represent the fold changes in the expression of the cell proliferation marker genes (A) and antioxidants as well as DNA repair genes (B) in acute (acute FA) and long-term (LT-FA) FA-treated Caki-1 cells as compared to the untreated control cells (control = 1-fold). Error bar showing the standard deviation (±SD) of the mean of triplicate values. Statistically significant (P < 0.05) changes in treated groups as compared to control are shown by the symbol “*”. The statistical significance of the cotreatment of NAC as compared to folic acid alone acute treatment is shown by the symbol “#”, whereas statistically significant changes in the cotreatment of NAC and FA as compared to FA alone in long-term treated cells are shown by the symbol “%”.
