Figure 4.

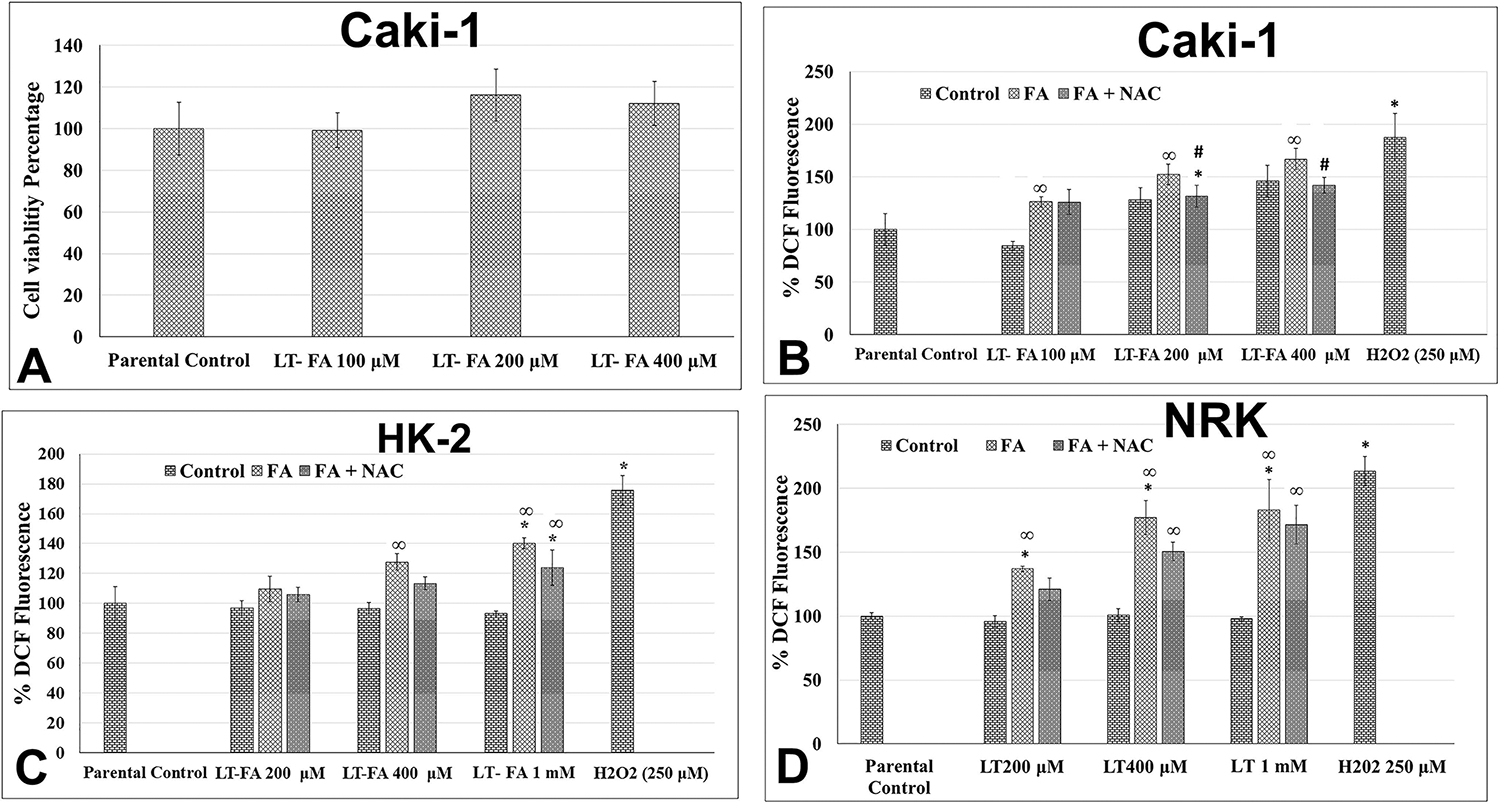
Effect of long-term exposure to folic acid (FA) on the growth and intracellular ROS production in kidney epithelial cells. Bar graph representing cell viability in percentage (control = 100%) in long-term FA-treated cells as measured by the MTT assay in Caki-1 cells (A), as well as intracellular levels of ROS in Caki-1 cells (B), HK-2 cells (C), and NRK cells (D). Different concentrations of FA as mentioned in the graph were used both alone and in combination with 25 μM of NAC. Error bars represent the standard deviation (±SD) of the mean of triplicate values. Statistically significant (P < 0.05) changes in treated groups as compared to control are shown by the symbol “*”. Statistically significant changes in the NAC and FA cotreatment groups as compared to FA alone are shown by the symbol “#”. Statistically significant changes in the NAC and FA cotreatment groups as compared to the untreated control are shown by the symbol “∞”.
